In CNC machining, besides material and dimensional accuracy, surface quality is one of the core requirements. Different parts have completely different requirements for surface roughness (Ra value) and surface finish.
To visually display these parameters and their corresponding machining methods, engineers and clients often use a surface finish chart.
This chart not only helps clients better understand the relationship between values (like Ra, Rz, etc.) and the actual surface effect, but also serves as a communication standard to avoid quality issues caused by misunderstandings.
If you’re looking for a quick reference, you can download our comprehensive Surface Finish Chart directly via the links below. Prefer to build a deeper understanding? Continue reading our blog for a complete guide to surface finish.
Key Takeaways:
Surface roughness definition, measurement units, symbol and parameters are explained.
Surface Roughness Chart is provided in Metric Units and Imperial Units.
Waviness describes larger-scale, periodic undulations on a surface that occur over a broader spacing than roughness.
Note:
The charts used in this article are all created by ECOREPRAP. Downloads are free. If you have any questions or concerns, please feel free to contact us directly
Before we dive into the definition of surface finish, let’s first explore why surface finish matters so much. It’s about far more than just making a part look good—it’s a fundamental factor that directly controls the CNC machining parts tolerance and CNC parts performance. 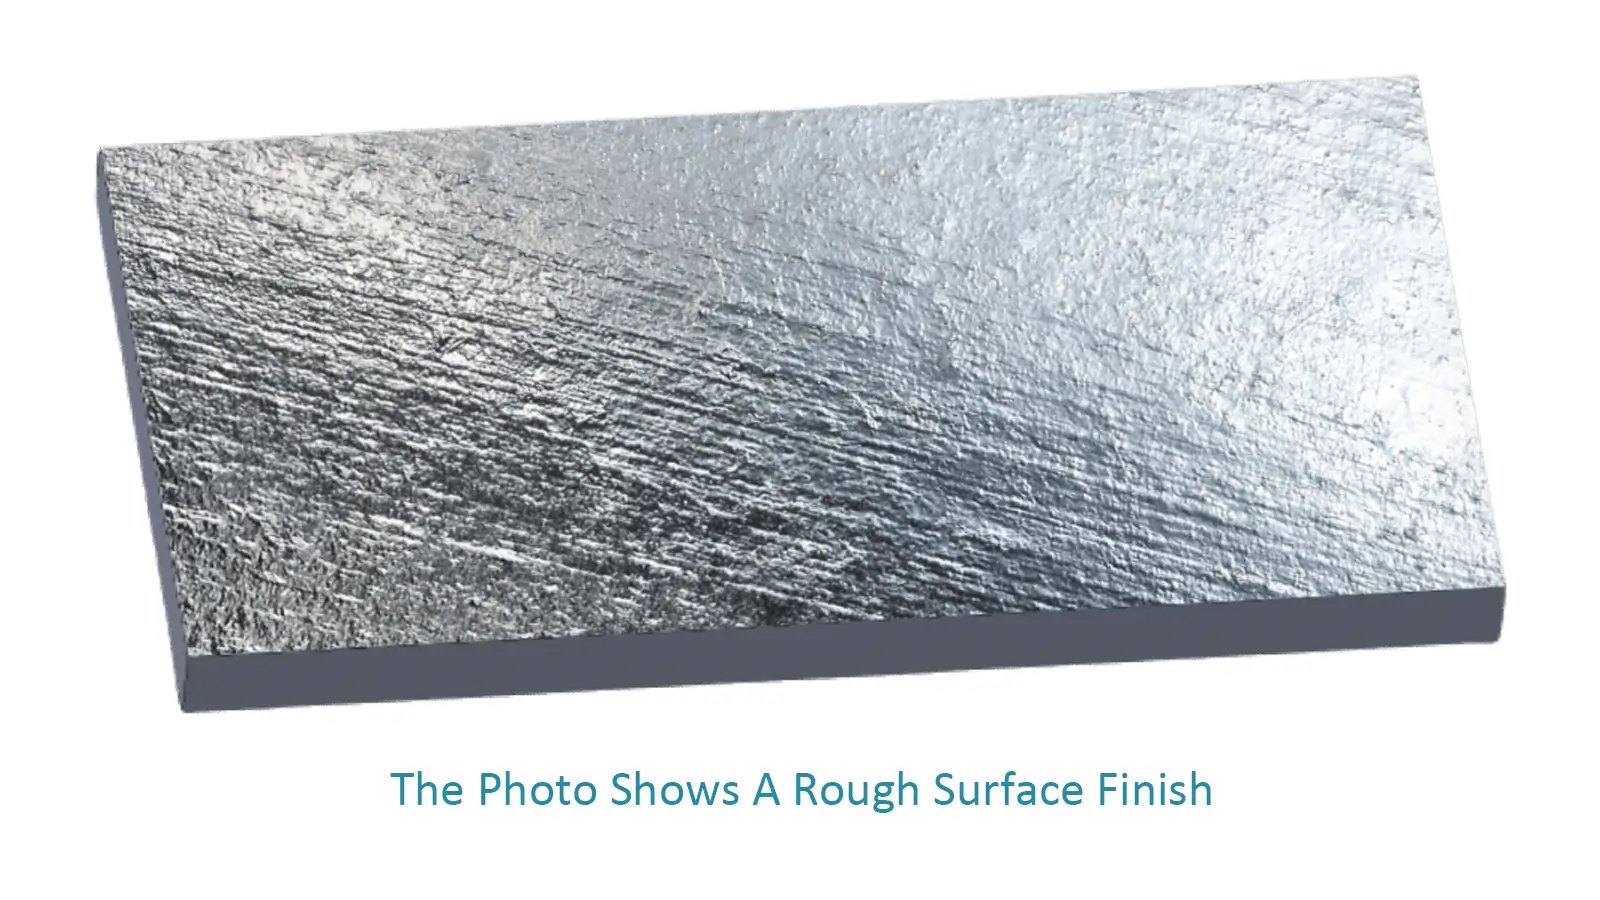
Here are the main reasons surface finish is critical:
A smooth surface has a much lower friction, so parts glide past each other easily. This dramatically reduces wear and tear, making your components—like those in an engine or a machine—last much longer.
If a surface is too rough for a tight fit, the bumps can get flattened when you press the parts together. This means the fit isn’t as strong as it should be.
For things like hydraulic cylinders, a smooth surface is essential to create a perfect seal and prevent any fluid from leaking out.
A rough surface has lots of tiny nooks and crannies where moisture, dirt, and chemicals can hide, speeding up corrosion and rust.
A smooth surface is much harder for contaminants to stick to, which naturally makes it more resistant to rust and corrosion.
When two parts mate, they only make contact at the microscopic peaks. A rough surface means a smaller true contact area, which leads to lower contact stiffness and potential micro-movements under load.
With surface finish treatment services like painting, powder coating, or plating, it requires the base material to have a specific surface profile. The right finish ensures that coatings adhere firmly and uniformly, preventing peeling or blistering.
Finally, there’s aesthetics. A high-quality surface finish makes a product look and feel premium, which is a huge selling point, especially for consumer electronics or high-end machinery.
Simply put, Surface Finish is a broad, comprehensive concept that refers to the overall quality and visual effect of a part’s surface after it has been machined. It’s not just about a single number; it includes all of the microscopic surface features and how they come together.
According to Wikipedia. Surface finish is also known as surface texture or surface topography.
Here are the key components we look at when we talk about surface finish: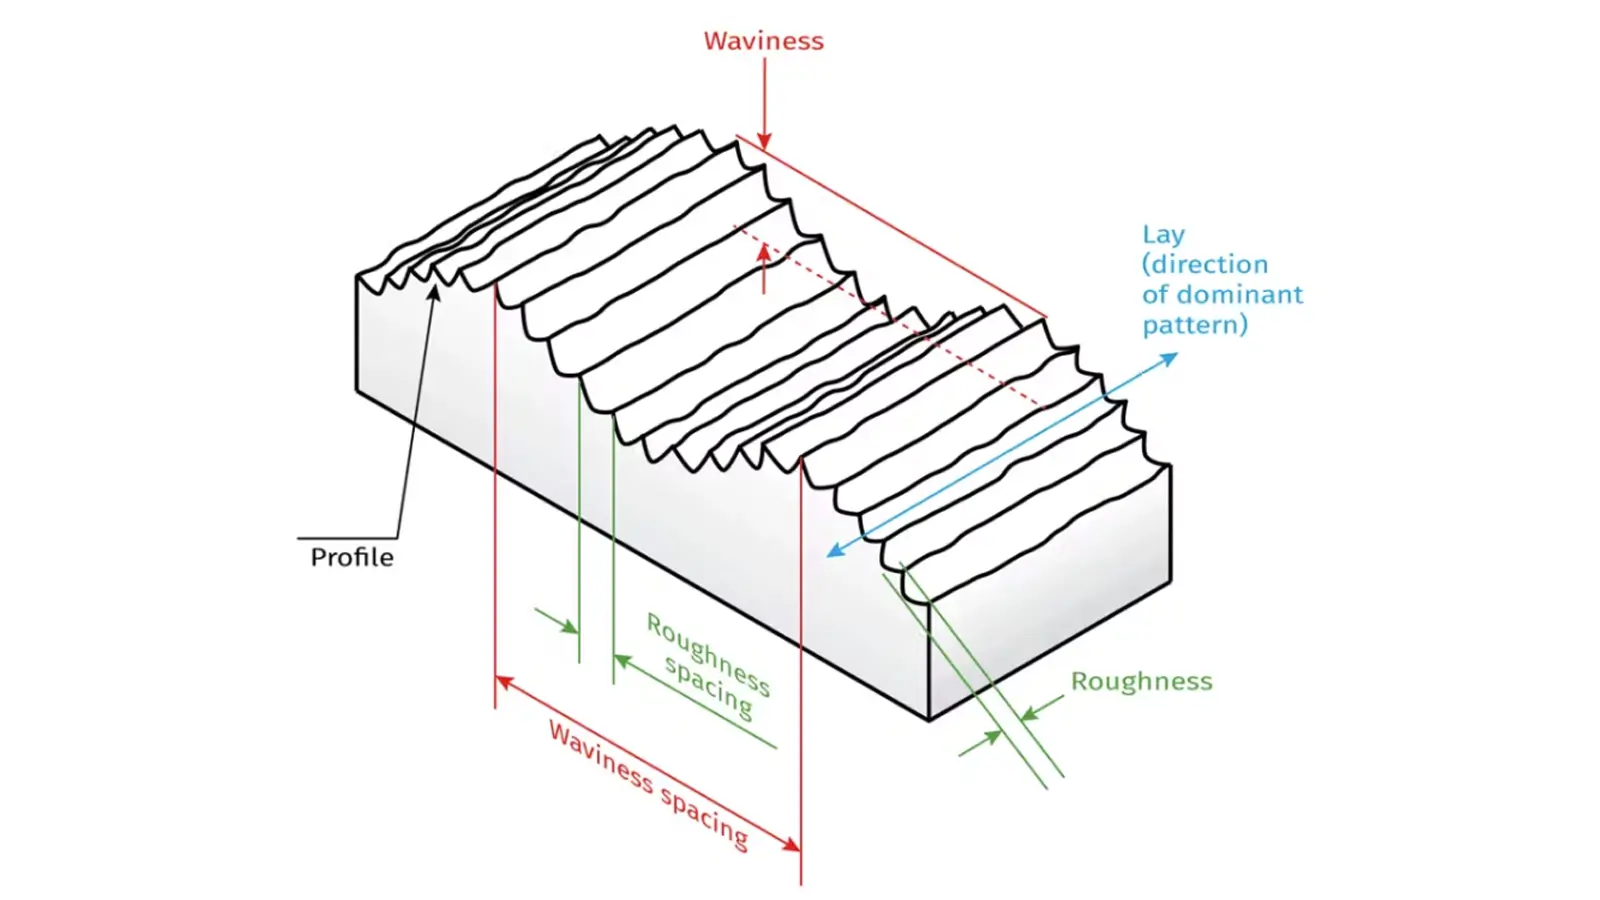
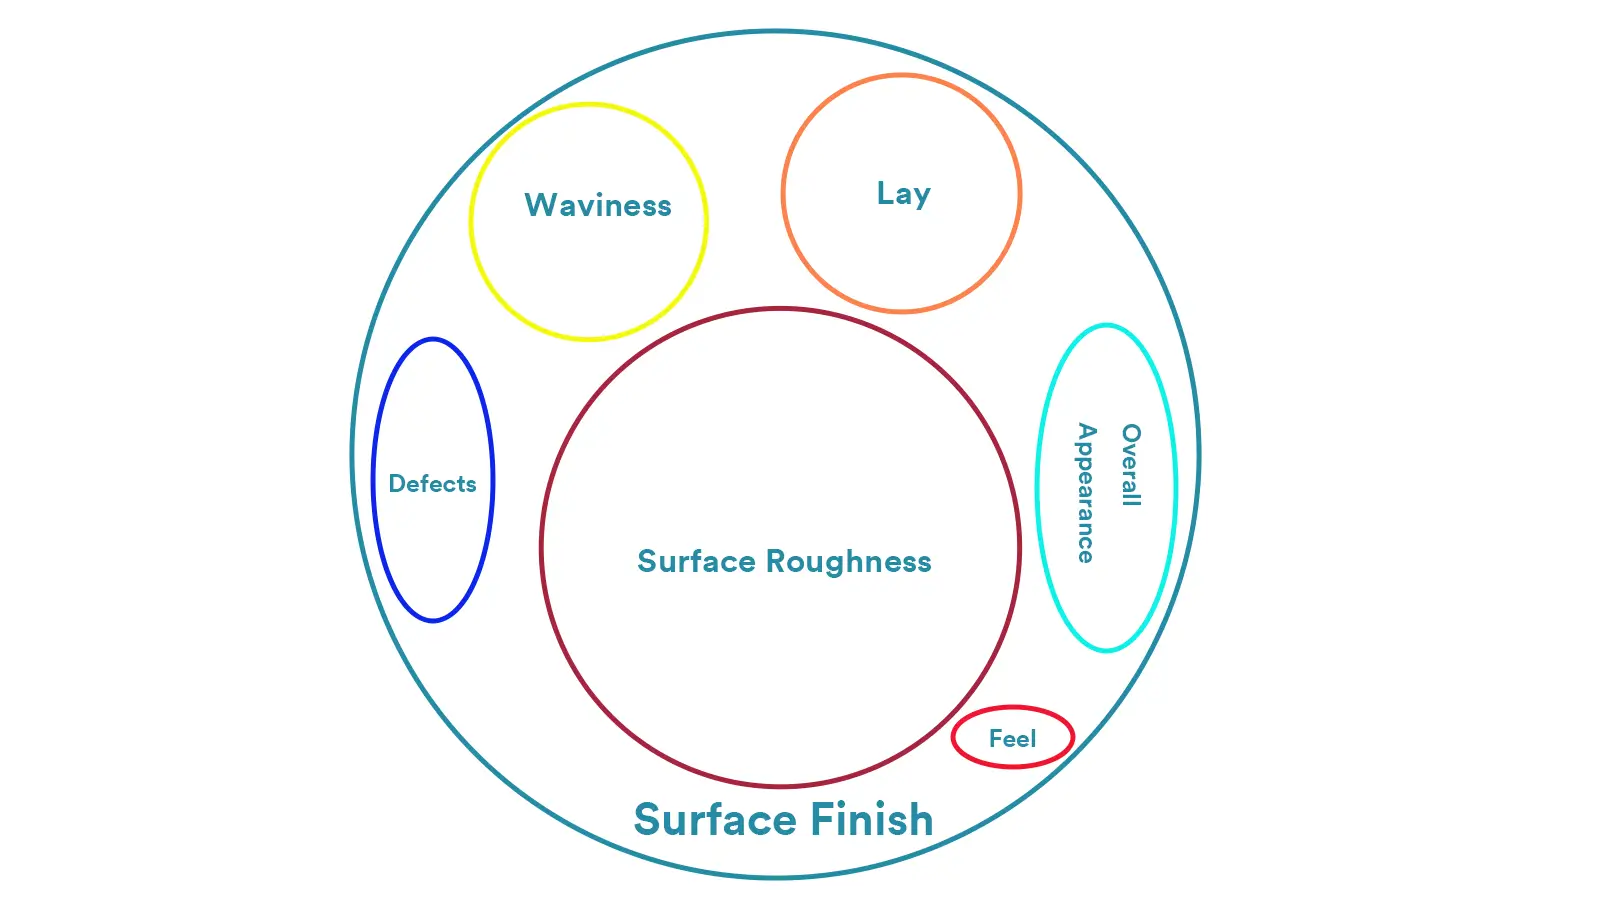 Beyond those three main terminologies—surface roughness, waviness, and lay— a complete assessment of surface finish also considers:
From what we talk above, we can see surface finish is a surface or area concept that encompasses the overall quality and visual effect.
We will explore surface roughness, waviness, and lay in details below.
If we think mathematically, surface finish includes surface roughness, and roughness is a subset within the broader surface finish.
Surface Roughness refers to the microscopic unevenness present on a machined surface, specifically describing the microscopic geometric features composed of tiny peaks and valleys on the part surface. It is an important indicator of surface quality.
Surface roughness is typically characterized by parameters such as peak height and peak spacing. The smaller the roughness, the smoother the surface.
It does not refer to the overall flatness of a surface (which is waviness), but rather the microscopic fluctuations of the surface profile over a very short distance.
Core concept: Surface roughness ignores large-scale shape errors (such as roundness or flatness errors) and mid-scale features like waviness, instead focusing on the short wavelength, closely spaced surface profile fluctuations.
Even surfaces that appear smooth at a glance are still uneven under a microscope. Roughness quantifies the height and spacing of these microscopic “mountain peaks” (peaks) and “valleys” (troughs).
Imagine looking at a city map: if waviness measures the overall terrain of the city (like hills), then surface roughness measures how smooth or bumpy the streets are.
In engineering drawings and manufacturing, surface roughness values are expressed in length units to quantify the irregularities of a surface. The smaller the value, the smoother the surface.
The default unit is micrometer, commonly used under international standards (ISO) and widely applied in global manufacturing, machining, and quality inspection.
Conversion: 1 µm = 0.001 mm 1 µm = 0.000039 inch
microinches is commonly used in the United States and other countries that still rely on imperial units, especially in aerospace and certain high-precision industries.
Definition: 1 µin = 0.000001 inch
1 µm ≈ 39.37 µin In practice, it is often simplified to: 1 µm ≈ 40 µin
Below, we are going to explain common surface roughness parameters, which is used to measure surface roughness value.
Ra refers to Arithmetic Average Roughness. It is the most commonly used surface roughness parameter.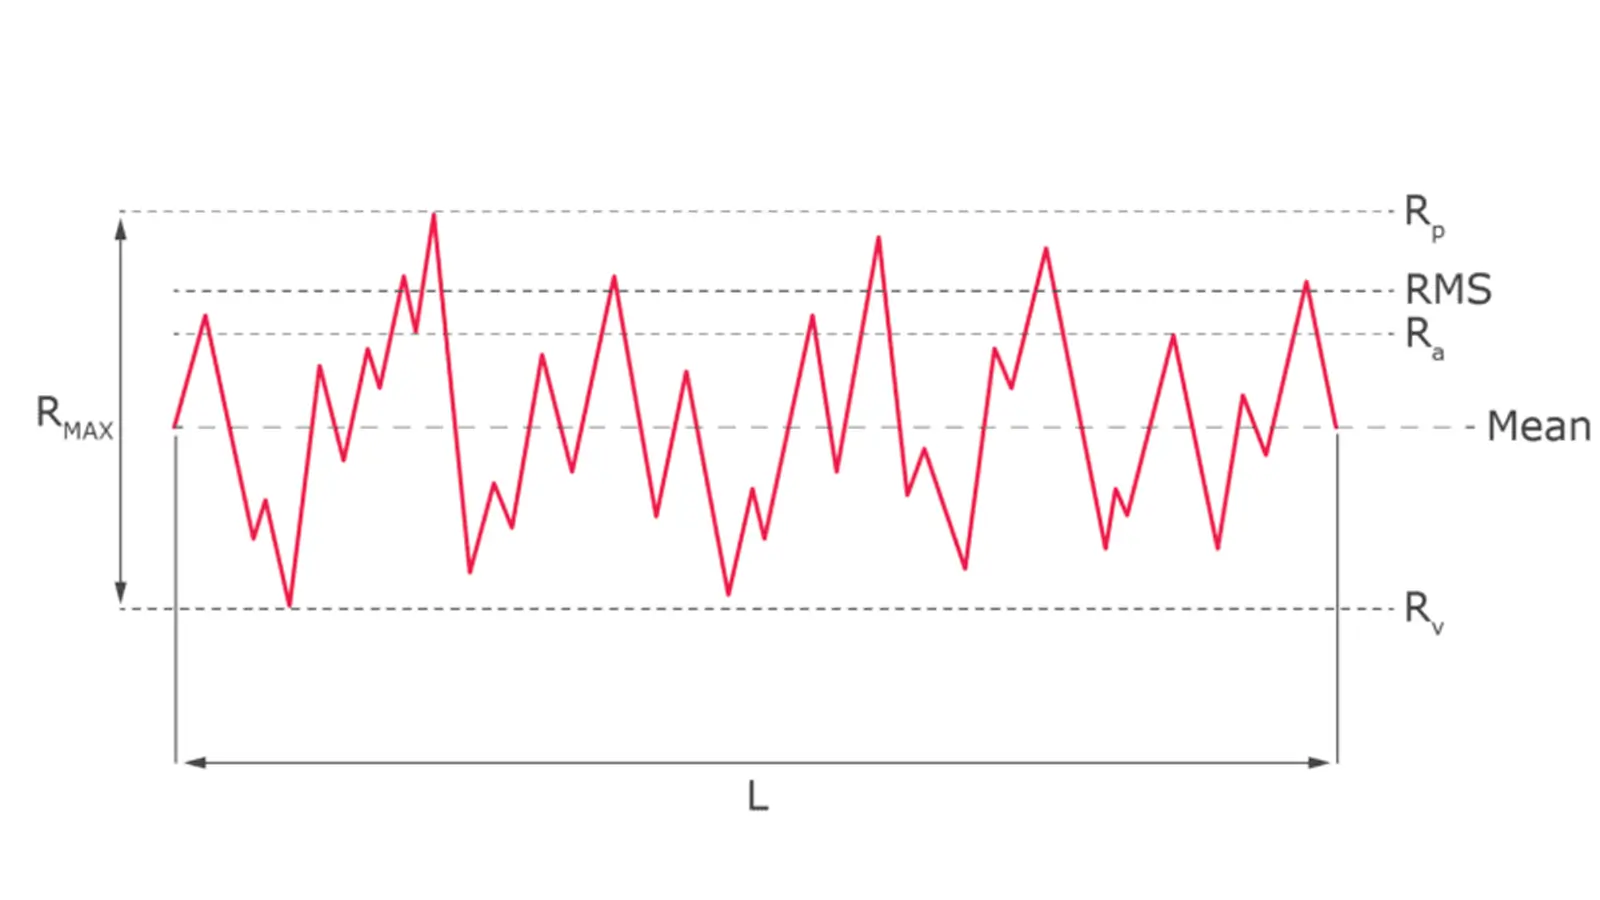
Ra definition is the arithmetic average of the absolute deviations of the surface profile from the reference line, measured over the sampling length.It’s also called the Center Line Average (CLA).
Ra describes the average height deviation of the surface profile curve relative to a baseline. It reliably reflects the overall roughness level of a surface and is the most widely applied parameter in industry.
Ra has become the default parameter for a few key reasons:
The formula to calculate Ra is:

L = evaluation length
z(x) = deviation of the surface profile from the mean line
|z(x)| = absolute value to include both peaks and valleys
Below is an example calculation of Ra Value.
Suppose the surface profile is sampled at 5 discrete points within the sampling length, with height deviations (in micrometers): z={1,−2,3,−1,2}
The photo below shows the steps to calculate Ra:
Take the absolute values:∣z∣={1,2,3,1,2}
Calculate the average:
So, the arithmetic average roughness Ra over this section is 1.8 micrometers.
The Ra value gives you a stable, overall average of the surface texture. It is an excellent general-purpose parameter.
However, because it is an average, it cannot identify isolated, extreme defects like a single deep scratch or a high burr, as their impact gets “averaged out” across the entire length.
For detecting such extremes, other parameters like Rz (Maximum Height) are used in conjunction with Ra.
Rz full name is Average Maximum Height.
Rz is the average maximum height of the surface profile within the sampling length. It is calculated as the average of the heights of five peaks and five valleys.
More specifically, Rz (also known as the ten-point height) is the average of the sum of the five highest peaks and the five deepest valleys within the sampling length.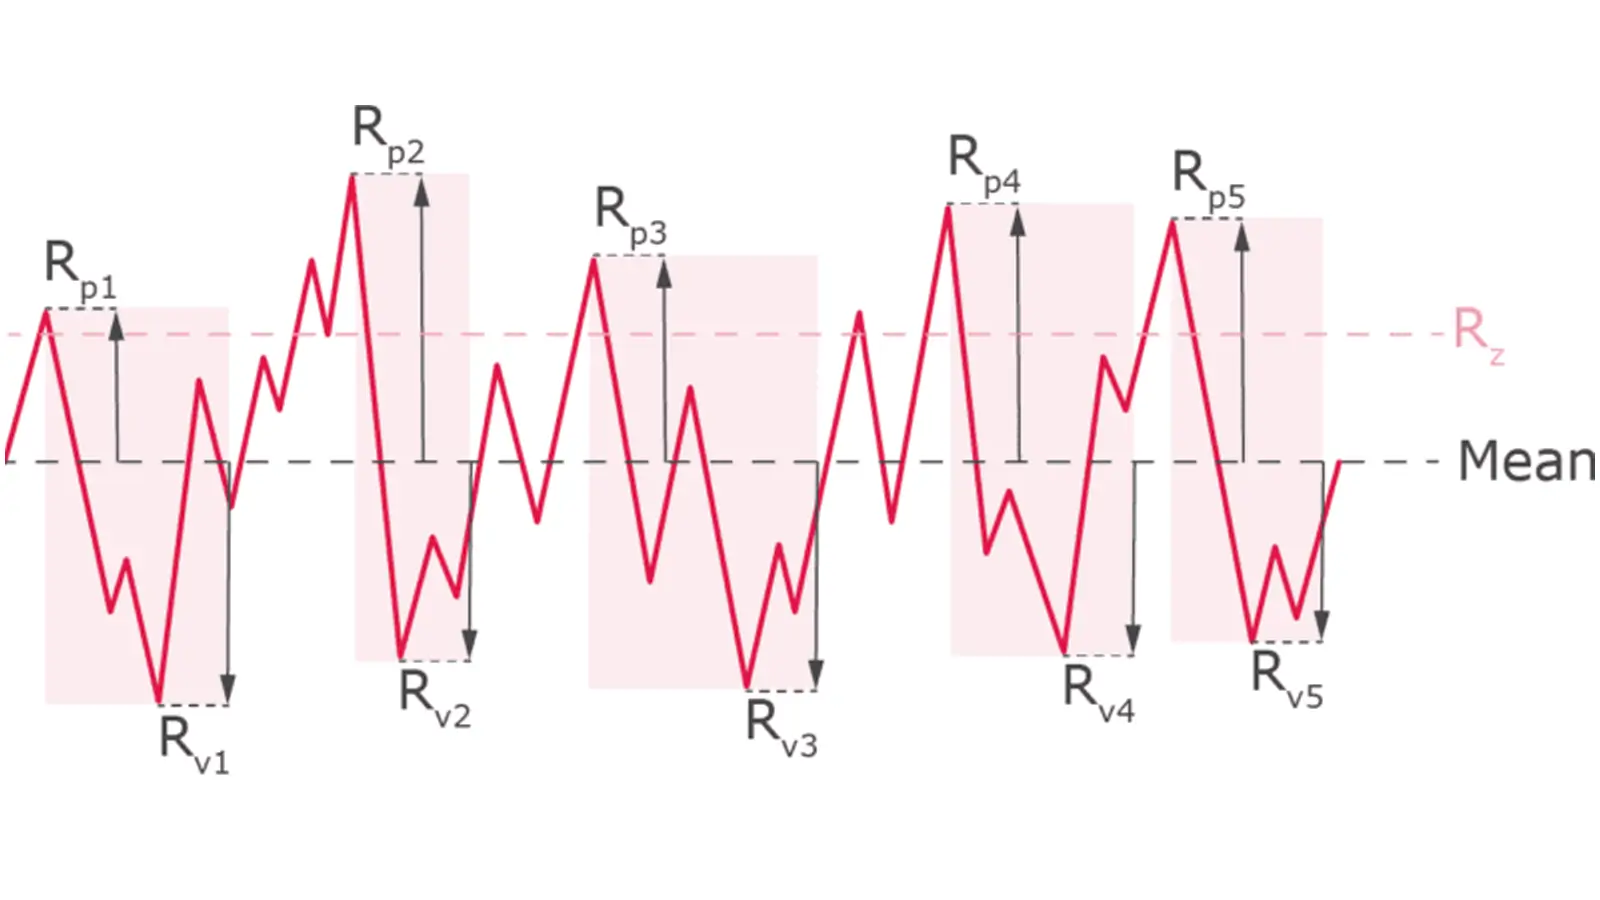
Rz better reflects extreme peaks and valleys on the surface and is very important for evaluating performance factors such as sealing and contact stiffness. In some industries, such as those following the German DIN standards, Rz is used more commonly than Ra.
The formula to calculate the Rz surface roughness value is:
This means you find the maximum height difference between peaks and valleys in each segment, then average these values for all five segments.
Rz reflects the average maximum vertical height variations of the surface roughness profile.
Suppose you have a roughness profile sampled over a length and divided into 5 equal segments. In each segment, the highest peak and the deepest valley heights (in micrometers, relative to the mean line) are:
| Segment | Highest Peak Zp (μm) | Deepest Valley Zv (μm) |
|---|---|---|
| 1 | 3.0 | -1.0 |
| 2 | 2.5 | -0.5 |
| 3 | 4.0 | -1.5 |
| 4 | 2.0 | -1.0 |
| 5 | 3.5 | -0.8 |
Step 1: Calculate peak-to-valley height in each segment
Rt,i=Zp,i−Zv,i
| Segment | Calculation | Result (μm) |
|---|---|---|
| 1 | 3.0 – (-1.0) = 4.0 | 4.0 |
| 2 | 2.5 – (-0.5) = 3.0 | 3.0 |
| 3 | 4.0 – (-1.5) = 5.5 | 5.5 |
| 4 | 2.0 – (-1.0) = 3.0 | 3.0 |
| 5 | 3.5 – (-0.8) = 4.3 | 4.3 |
Step 2: Calculate the average of the 5 peak-to-valley heights
Rz=(4.0+3.0+5.5+3.0+4.3)/5=19.8/5=3.96μm
Final Result
The Rz value, or average maximum height, for this profile is approximately 3.96 μm.
Ry (Rmax) is Maximum Peak-to-Valley Height.
Ry, also called Rmax, represents the maximum height difference between the highest peak and the deepest valley in the profile within the sampling length. It reflects the most extreme surface defect and is often used in quality control to set an unexceedable threshold.
Ry=Rmax=Rp+Rv
Where:
Rp = Height of the highest peak
Rv = Depth of the deepest valley
1.Measure the surface profile over the sampling length.
2.Identify the single highest peak height RpRp.
3.Identify the single deepest valley depth RvRv.
4.Calculate the vertical distance sum: Ry=Rp+Rv
If the highest peak Rp=4 μm and the deepest valley Rv=2 μm, then:Ry=4+2=6μm
Rp refers to Maximum Peak Height.
Rp is the height of the highest peak above the mean line in the sampling length.
It is the maximum vertical height value Rp=max(yi) where yi are surface profile heights.
Measure the surface profile over the sampling length.
Find the tallest peak above the mean line.
Rv is Maximum Valley Depth.
Rv is the depth of the deepest valley below the mean line in the sampling length.
It is the maximum depth Rv=∣min(yi), where yi are profile heights below the mean line.
Measure the surface profile over the sampling length.
Find the deepest valley below the mean line.
Below is a Summary Table of Key Roughness Parameters-Full Name, Definition, Purpose.
| Parameter | Full Name | Definition | Purpose |
|---|---|---|---|
| Ra | Arithmetic Average Roughness | The average height of all the peaks and valleys on a surface profile. | Provides a general indication of the overall surface texture. The most common parameter used. |
| Rz | Mean Roughness Depth | The average vertical distance between the highest peak and the lowest valley within five separate sampling lengths. | Detects slightly larger imperfections than Ra and provides a more stable value than Ry. |
| Ry (Rmax) | Maximum Peak-to-Valley Height | The vertical distance between the highest peak and the lowest valley within a single sampling length. | Detects the single most extreme flaw (e.g., a deep scratch or high burr). Good for setting a strict quality limit. |
| Rp | Maximum Peak Height | The vertical distance from the mean line to the single highest peak. | Identifies the single tallest peak on the surface, which could be a burr or bump. |
| Rv | Maximum Valley Depth | The vertical distance from the mean line to the single lowest valley. | Identifies the single deepest valley on the surface, which could be a pit or scratch. |
Ra (Average Roughness): This is the most common parameter. It’s a simple average of all the peaks and valleys on the surface.
Pro: Gives you a quick, overall picture of the surface texture.
Con: It’s not sensitive to extreme flaws like a single deep scratch or a high burr. A surface with a hidden defect could still have a “good” Ra value.
Rz (Mean Roughness Depth): This is a more specialized parameter. It calculates the average of the vertical distances between the five highest peaks and the five lowest valleys.
Pro: It’s much better at detecting significant flaws or inconsistencies. If there’s a deep scratch or a tall burr on the surface, Rz will pick it up, while Ra might not.
Con: It can be less stable than Ra and isn’t as widely used, so not everyone is familiar with it.
A surface can have a satisfactory Ra value but an out-of-tolerance Rz value due to a single deep scratch. Therefore, for critical functional surfaces, it is common to specify both Rz / Ra requirements.
These three parameters are closely related and collectively describe the most extreme profile features.
Core Formula: Rz = Rp + Rv
Rz is the total height difference, Rp focuses on the highest point (e.g., burrs), and Rv focuses on the lowest point (e.g., scratches).
According to the latest ISO standards, Rz is the correct parameter, which has replaced Ry and Rmax.
When reading older drawings, you can consider Ry or Rmax as equivalent to Rz.
When selecting a parameter, ask yourself: Do I want to control the overall average condition (Ra) of the surface, or do I need to ensure it has no unacceptable extreme defects (Rz)? For the most critical surfaces, using both is considered best practice.
While there are no strict mathematical formulas to convert between Ra, Rz, and Ry, the industry uses some common rules of thumb for quick estimates. These are not exact conversions but helpful guidelines for evaluation.
Please remember: These values are for reference only and should not be used for strict design requirements. Always refer to your measurement instruments and standards (like ISO 4287) for precise values.
Here are the most common empirical formulas:
Rz ≈ 4 to 7 × Ra
The ISO 4287/4288 standard often uses the approximation
Rz ≈ 5 × Ra.
Example:
If your Ra value is 0.8 µm, the Rz value would be roughly 4 to 6 µm.
Ry (or Rmax) ≈ 4 to 7 × Ra
Since Ry and Rz are often similar in value, you can also use the approximation Ry ≈ 5 × Ra.
The reason for this is that while Ra averages the entire surface, Rz and Ry focus on the extreme peaks and valleys. On a normal surface, the average peak/valley height (Ra) is a fraction of the maximum peak/valley height (Rz/Ry).
Empirical Conversion Relationships Between Roughness Parameters Table
| Parameter Comparison | Approximate Empirical Relationship | Description |
|---|---|---|
| Rz and Ra | Rz≈4×Ra | Rz is usually about 4 times Ra. Rz reflects larger scale peak heights and is more sensitive to extreme peaks. |
| Ry (Rmax) and Ra | Ry≈5×Ra | The maximum height Ry is about 5 times Ra, mainly reflecting the height difference of extreme peaks and valleys. |
| Ry and Rz | Ry≈1.25×Rz | Ry is the maximum peak-to-valley height, generally slightly larger than Rz. |
The following table provides approximate empirical conversions between common roughness parameters. These values are typical for regularly machined surfaces but can vary based on material and process.
Commonly Used Surface Roughness Conversion Chart (Empirical Values – Metric Units)
| Ra (μm) | Rz (μm) | Ry / Rmax (μm) | Equivalent Machining Grade & Notes |
|---|---|---|---|
| 0.1 | 0.5 | 0.5 – 0.7 | Ultra-Smooth: Grinding, honing, lapping. Precision bearings, optical surfaces. |
| 0.2 | 1 | 1.0 – 1.2 | Very Smooth: Fine grinding, precision machining. |
| 0.4 | 2 | 2.0 – 2.5 | Smooth / Fine Finish: Precision grinding, fine turning. High-quality functional parts. |
| 0.8 | 4 | 4.0 – 5.0 | Good Finish: Regular grinding, fine milling. Common for bearings, cylinders. |
| 1.6 | 8 | 8.0 – 10.0 | Standard Machining: Common turning, milling, boring. Most common for general parts. |
| 3.2 | 16 | 16 – 20 | Rough Machining: Rough turning, milling. Non-critical static surfaces. |
| 6.3 | 32 | 32 – 40 | Very Rough: Rough machining, sawing, casting. Non-contact surfaces. |
Commonly Used Surface Roughness Conversion Chart (Empirical Values – Imperial Units)
| Ra (µin) | Rz (µin) | Ry / Rmax (µin) | Equivalent Machining Grade & Notes |
|---|---|---|---|
| 4 | 20 | 20 – 28 | Ultra-Smooth: Grinding, honing, lapping. Precision bearings, optical surfaces. |
| 8 | 40 | 40 – 48 | Very Smooth: Fine grinding, precision machining. |
| 16 | 80 | 80 – 100 | Smooth / Fine Finish: Precision grinding, fine turning. High-quality functional parts. |
| 32 | 160 | 160 – 200 | Good Finish: Regular grinding, fine milling. Common for bearings, cylinders. |
| 63 | 320 | 320 – 400 | Standard Machining: Common turning, milling, boring. Most common for general parts. |
| 125 | 640 | 640 – 800 | Rough Machining: Rough turning, milling. Non-critical static surfaces. |
| 250 | 1250 | 1250 – 1600 | Very Rough: Rough machining, sawing, casting. Non-contact surfaces. |
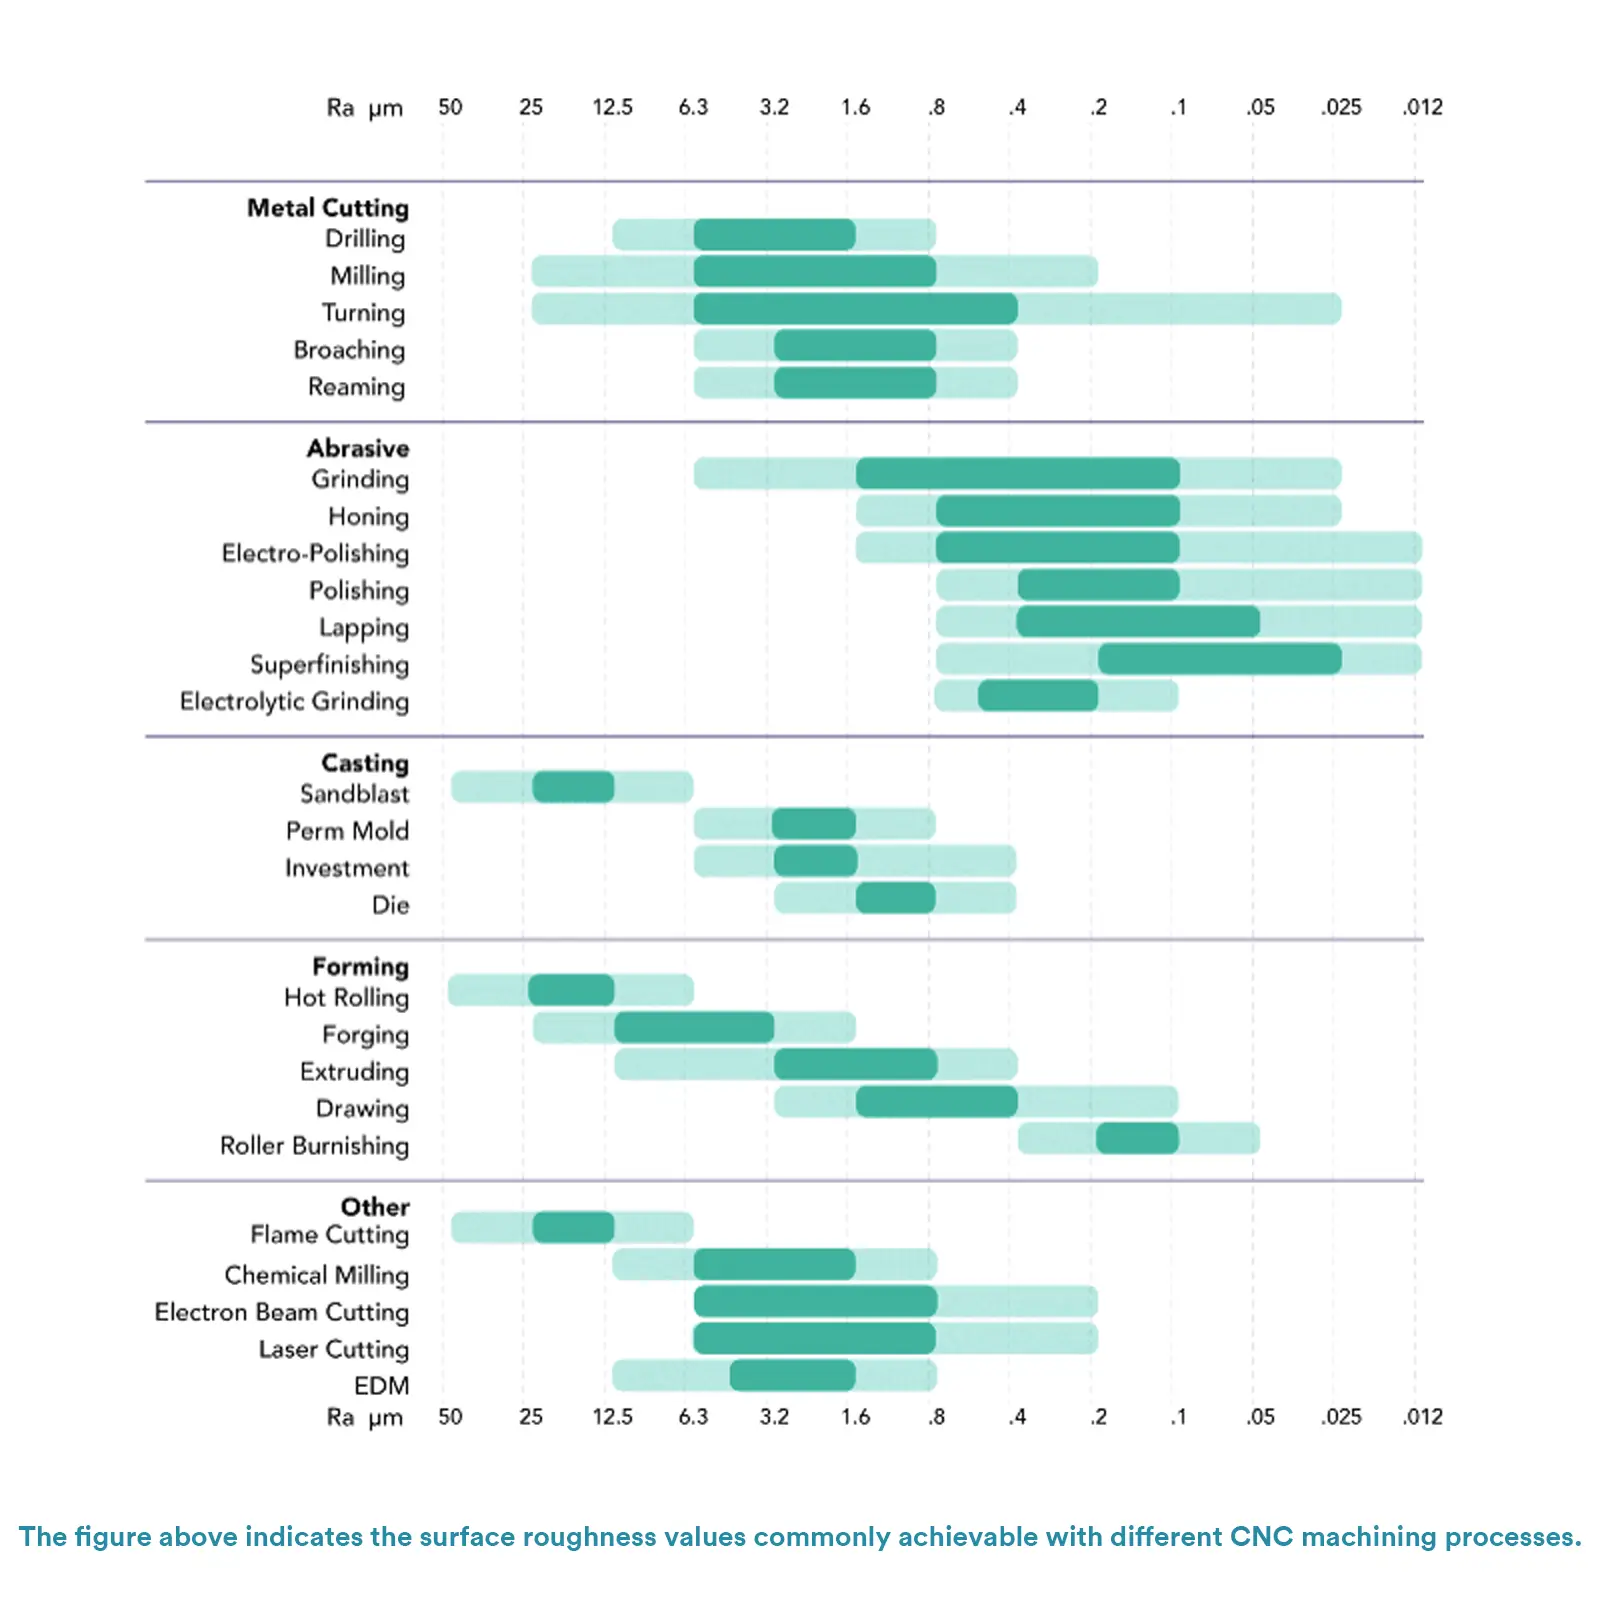
Below is CNC machining surface roughness chart.
Quick Conversion Reference (Metric to Imperial):
μm to μin: Multiply by 40 (Example: 1.6 μm × 40 = 64 μin)
μin to μm: Divide by 40 (Example: 125 μin ÷ 40 = 3.125 μm)
Internationally, several key standards govern the definition, measurement, and specification of surface roughness. These standards ensure consistency and clarity in technical communication across global manufacturing.
The most widely recognized international standards are the ISO series, with other major industrial nations maintaining their own equivalent national standards.
Comparison of International Surface Roughness Standards
| Standard | Region / Body | Full Name & Scope | Key Characteristics |
|---|---|---|---|
| ISO 4287 | International (ISO) | “Geometrical Product Specifications (GPS) — Surface texture: Profile method — Terms, definitions, and surface texture parameters. Defines the fundamental terms, parameters (like Ra, Rz, Rq), and their mathematical definitions.” | Provides the universal “dictionary” for surface texture. It is the foundational reference for other standards. |
| ISO 4288 | International (ISO) | “Geometrical Product Specifications (GPS) — Surface texture: Profile method — Rules and procedures for the assessment of surface texture. Specifies the practical rules for measurement: selection of sampling length, evaluation length, and material ratio curve.” | Provides the “grammar” for how to measure correctly. It ensures measurements are repeatable and comparable. |
| ASME B46.1 | United States | “Surface Texture (Surface Roughness, Waviness, and Lay). The comprehensive American national standard covering the definition, measurement, and specification of surface texture.” | Widely used in North America. Very similar to ISO standards, with minor differences in parameter definitions and practices. |
| GB/T 3505-2009 | China | “Geometrical Product Specifications (GPS) — Surface texture: Profile method — Terms, definitions, and surface texture parameters. The Chinese national standard, technically identical to ISO 4287.” | The official standard for China. Adopts ISO standards to ensure international alignment. |
| JIS B 0601 | Japan | “Geometrical Product Specifications (GPS) — Surface texture: Profile method — Terms, definitions, and surface texture parameters. The Japanese Industrial Standard. The latest version (2001, 2013) has been harmonized with ISO 4287.” | Historically had notable differences (e.g., old JIS Rmax), but modern versions are aligned with ISO. Important for projects involving Japanese industry. |
| ISO Grade Number | Ra (μm) | Ra (μin) | RMS (μin) | CLA (μin) | Rt (μm) | Application Level & Typical Processes |
|---|---|---|---|---|---|---|
| N12 | 50 | 2000 | 2200 | 2000 | 200 | Rough Machining Sawing, rough turning, rough milling, cast surfaces |
| N11 | 25 | 1000 | 1100 | 1000 | 100 | |
| N10 | 12.5 | 500 | 550 | 500 | 50 | |
| N9 | 6.3 | 250 | 275 | 250 | 25 | General Machining Regular turning, milling, drilling |
| N8 | 3.2 | 125 | 137.5 | 125 | 13 | |
| N7 | 1.6 | 63 | 64.3 | 63 | 8.0 | |
| N6 | 0.8 | 32 | 32.5 | 32 | 4.0 | Precision Machining Fine grinding, precision turning, reaming |
| N5 | 0.4 | 16 | 17.6 | 16 | 2.0 | |
| N4 | 0.2 | 8 | 8.8 | 8 | 1.2 | |
| N3 | 0.1 | 4 | 4.4 | 4 | 0.8 | Ultra-Precision Lapping, honing, polishing, precision bearings |
| N2 | 0.05 | 2 | 2.2 | 2 | 0.5 | |
| N1 | 0.025 | 1 | 1.1 | 1 | 0.3 |
When creating technical drawings, it is good practice to reference the specific standard used (e.g., “ISO 4287”) to eliminate any ambiguity. For most international projects, the ISO standards are the preferred choice.
Surface roughness can be measured in a few different ways, depending on the required accuracy, the type of part, and the environment.
Contact Measurement
This method uses a specialized instrument with a physical stylus, similar to a record player’s needle.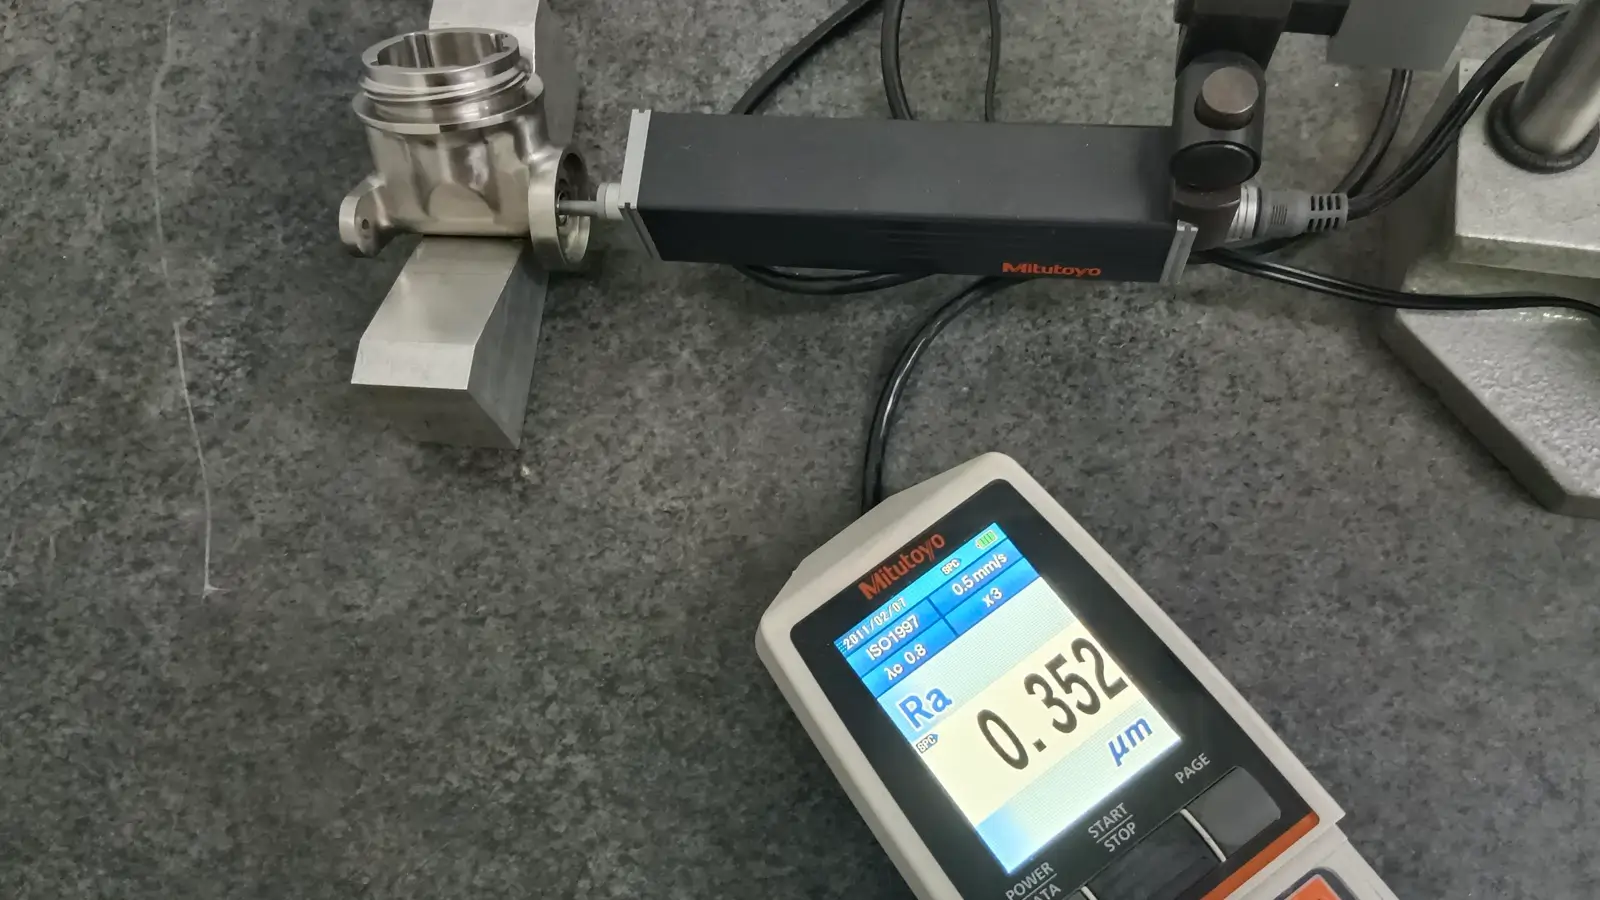
How It Works: A very fine diamond stylus (with a tip radius of about 2-10 micrometers) is moved slowly across the surface. The stylus moves up and down as it follows the surface’s peaks and valleys, and its movement is converted into an electrical signal. This data is then processed to calculate parameters like Ra and Rz.
Instrument: Surface Roughness Tester or Stylus Profilometer.
Pros: It’s a highly reliable and accurate method that is recognized by international standards.
Cons: The stylus can potentially scratch very soft or highly-polished surfaces. The process is also relatively slow.
Non-Contact Measurement
This method uses optical or other non-physical techniques to scan the surface.
How It Works: Instead of a physical probe, these instruments use technology like light or sound waves.
Common techniques include:
Optical Interferometry: Uses light wave interference to generate a 3D map of the surface.
Laser Scattering: Analyzes how a laser beam scatters off a surface to assess its roughness.
Pros: It’s fast and will not damage the workpiece, making it ideal for soft materials or mirror-like surfaces.
Cons: The equipment is typically more expensive, requires a very clean and non-reflective surface, and the measurements can be sensitive to environmental vibrations.
Comparison Method
This is a quick and simple way to get a rough estimate of the surface quality.
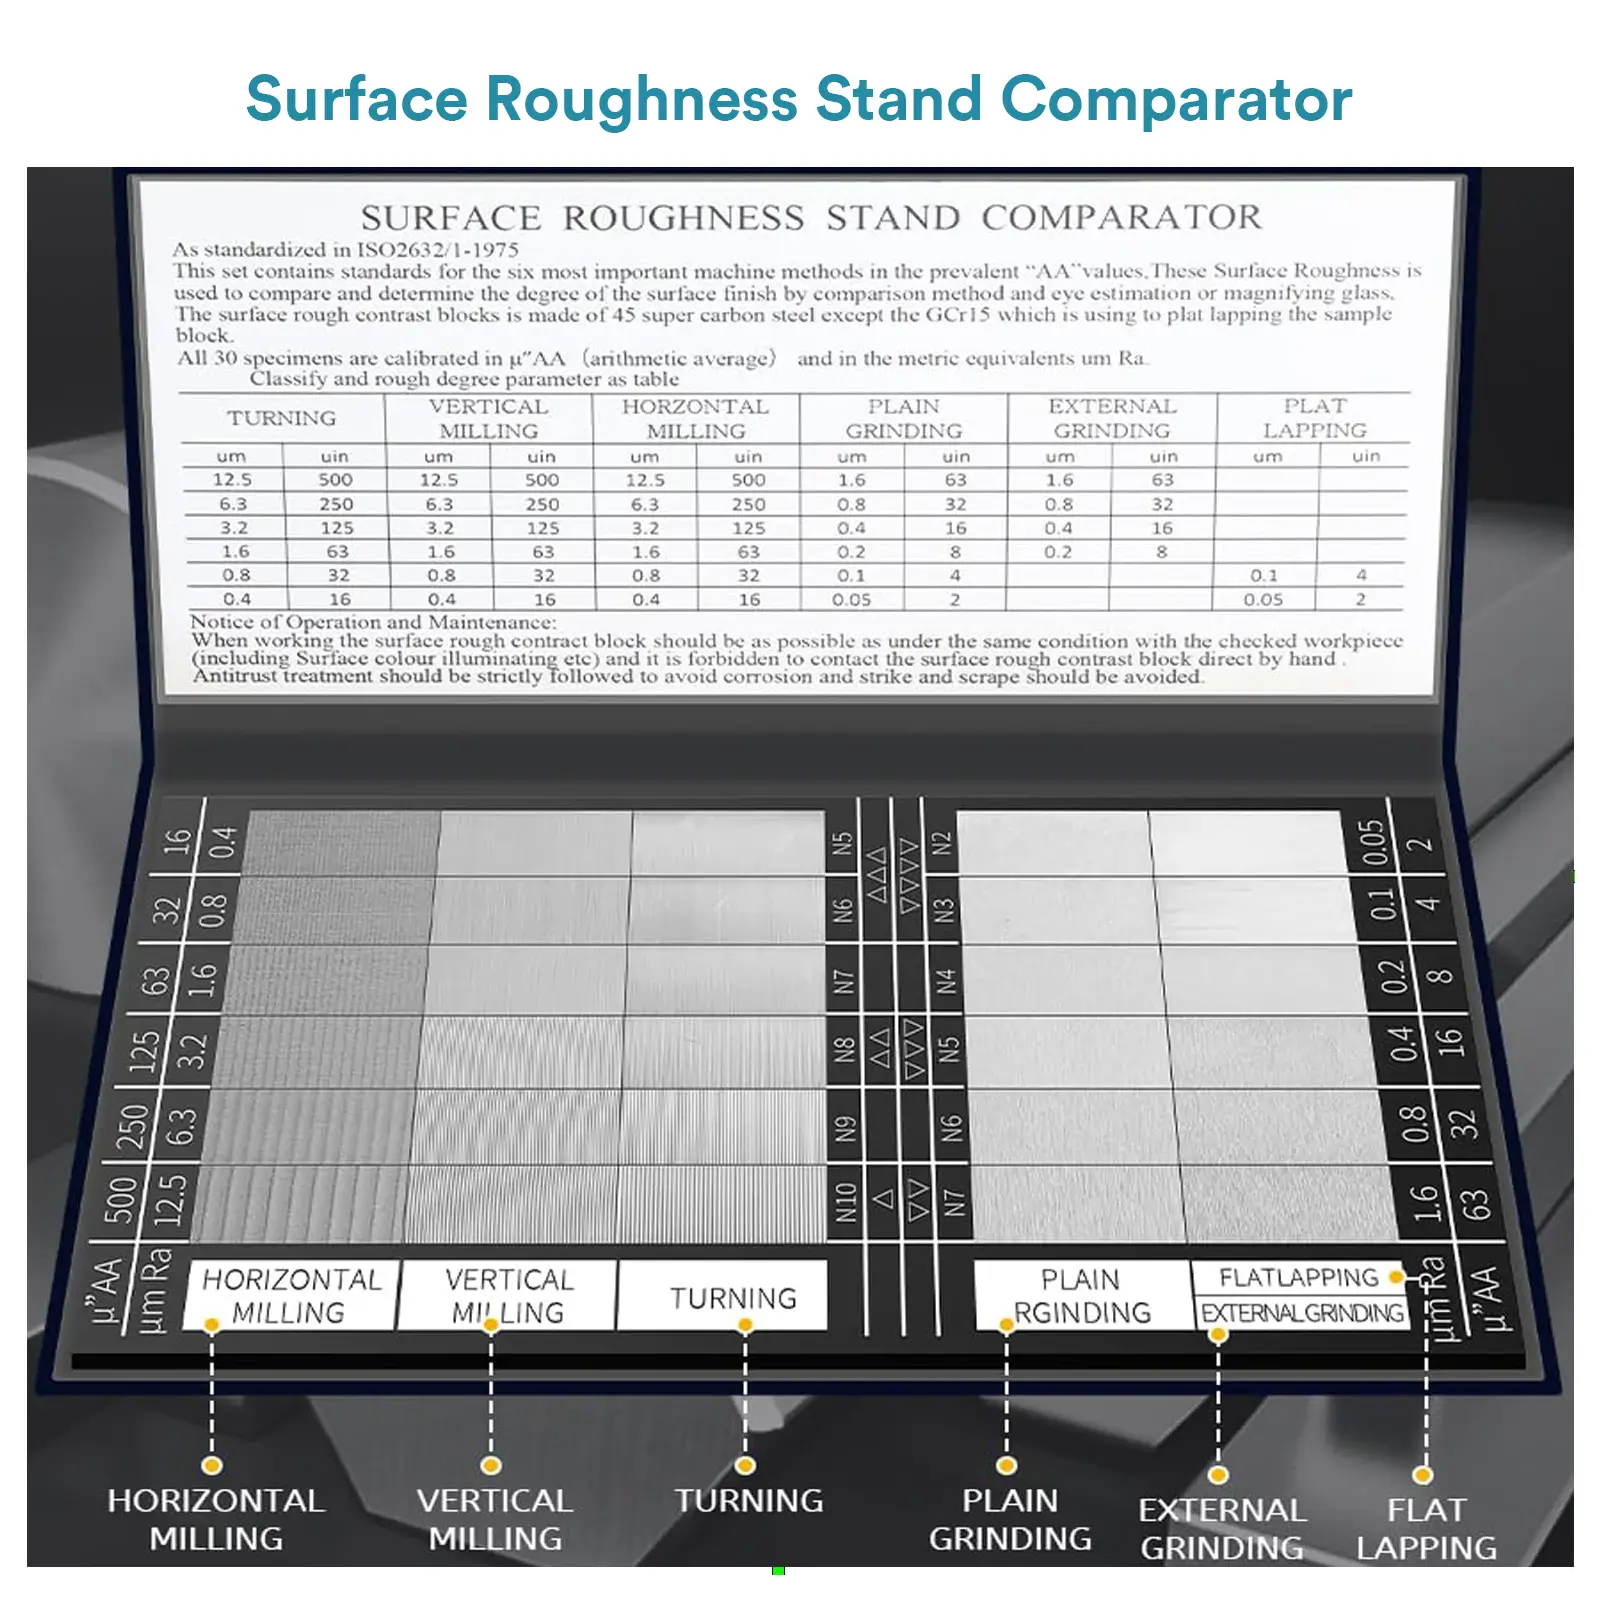
How It Works: You use a set of standardized roughness comparison blocks with known Ra values. You then visually inspect and manually touch the workpiece to the reference blocks to find the closest match.
Pros: It’s fast, simple, and very cost-effective. It’s great for quick checks on the shop floor.
Cons: It’s highly subjective and has low accuracy. It should only be used for rough estimates and not as the basis for a final quality inspection.
| Method | Principle | Instrument | Advantages | Disadvantages | Best For |
|---|---|---|---|---|---|
| Contact | Physical stylus traces surface | Profilometer | Reliable, standardized, direct profile | Risk of damage, slower | Standard quality control, most materials |
| Non-Contact | Light-based scanning | Optical Profiler, Confocal Microscope | Fast, no damage, high-resolution 3D | Expensive, sensitive to surface properties | Delicate, soft, or ultra-smooth surfaces |
| Comparison | Visual/tactile comparison to samples | Roughness Sample Set | Fast, inexpensive, portable | Subjective, low accuracy | Shop-floor rough estimation |
The choice of measurement method depends on the required accuracy, the nature of the surface, the available budget, and the application context. For formal inspection and reporting, contact or non-contact methods are essential. The comparison method serves only as a useful, informal tool for rapid assessment.
Waviness is one of the three primary characteristics of surface finish. It describes larger-scale, periodic undulations on a surface that occur over a broader spacing than roughness. Specifically, waviness is characterized by widely spaced peaks and valleys, typically caused by factors such as workpiece deformation during machining, machine tool vibration, and thermal expansion/contraction.
Compared to roughness, waviness has a longer wavelength (the distance from one peak to the next) and generally exceeds the sampling length used for roughness measurement. Waviness can significantly affect a part’s fit and functional performance—for example, excessive waviness on a sealing surface may lead to leakage or poor assembly.
While it may not seem as microscopic as roughness, waviness can have a more direct and significant impact on a part’s function.
Seal Failure: Even if a surface has great roughness, excessive waviness can create tiny channels that lead to leaks in seals on fluid systems.
Poor Fit and Stiffness: When two parts are supposed to fit together, waviness reduces the actual contact area. This can lower the part’s stiffness and cause vibration under load.
Uneven Motion: On parts that move against each other, like bearings and guides, waviness can cause chatter, noise, and jerky motion.
Uneven Coatings: For processes like painting or plating, waviness can lead to an uneven layer thickness, which affects both appearance and corrosion resistance.
Waviness often results from large-scale periodic vibrations or instabilities during machining, such as:
Machine tool vibration (e.g., unbalanced spindle, tool runout)
Feed system inaccuracies (e.g., lead screw backlash, guideway fluctuation)
Workpiece or fixture deformation
Periodic variation in cutting forces
Waviness parameters such as Wa are highly sensitive to machine vibration and thermal distortion, making them important indicators of overall surface condition.
To minimize waviness, address the root causes of machining instability:
Improve Machine Accuracy: Regular maintenance of spindles and guideways.
Optimize Workholding: Ensure rigid clamping of workpiece and tool; avoid excessive overhang.
Suppress Vibration: Adjust cutting parameters (speed, feed, depth of cut); use damped tools or fixtures.
Select Appropriate Processes: For high-demand surfaces, follow finishing with spark-out grinding, lapping, or polishing—processes effective in reducing waviness.
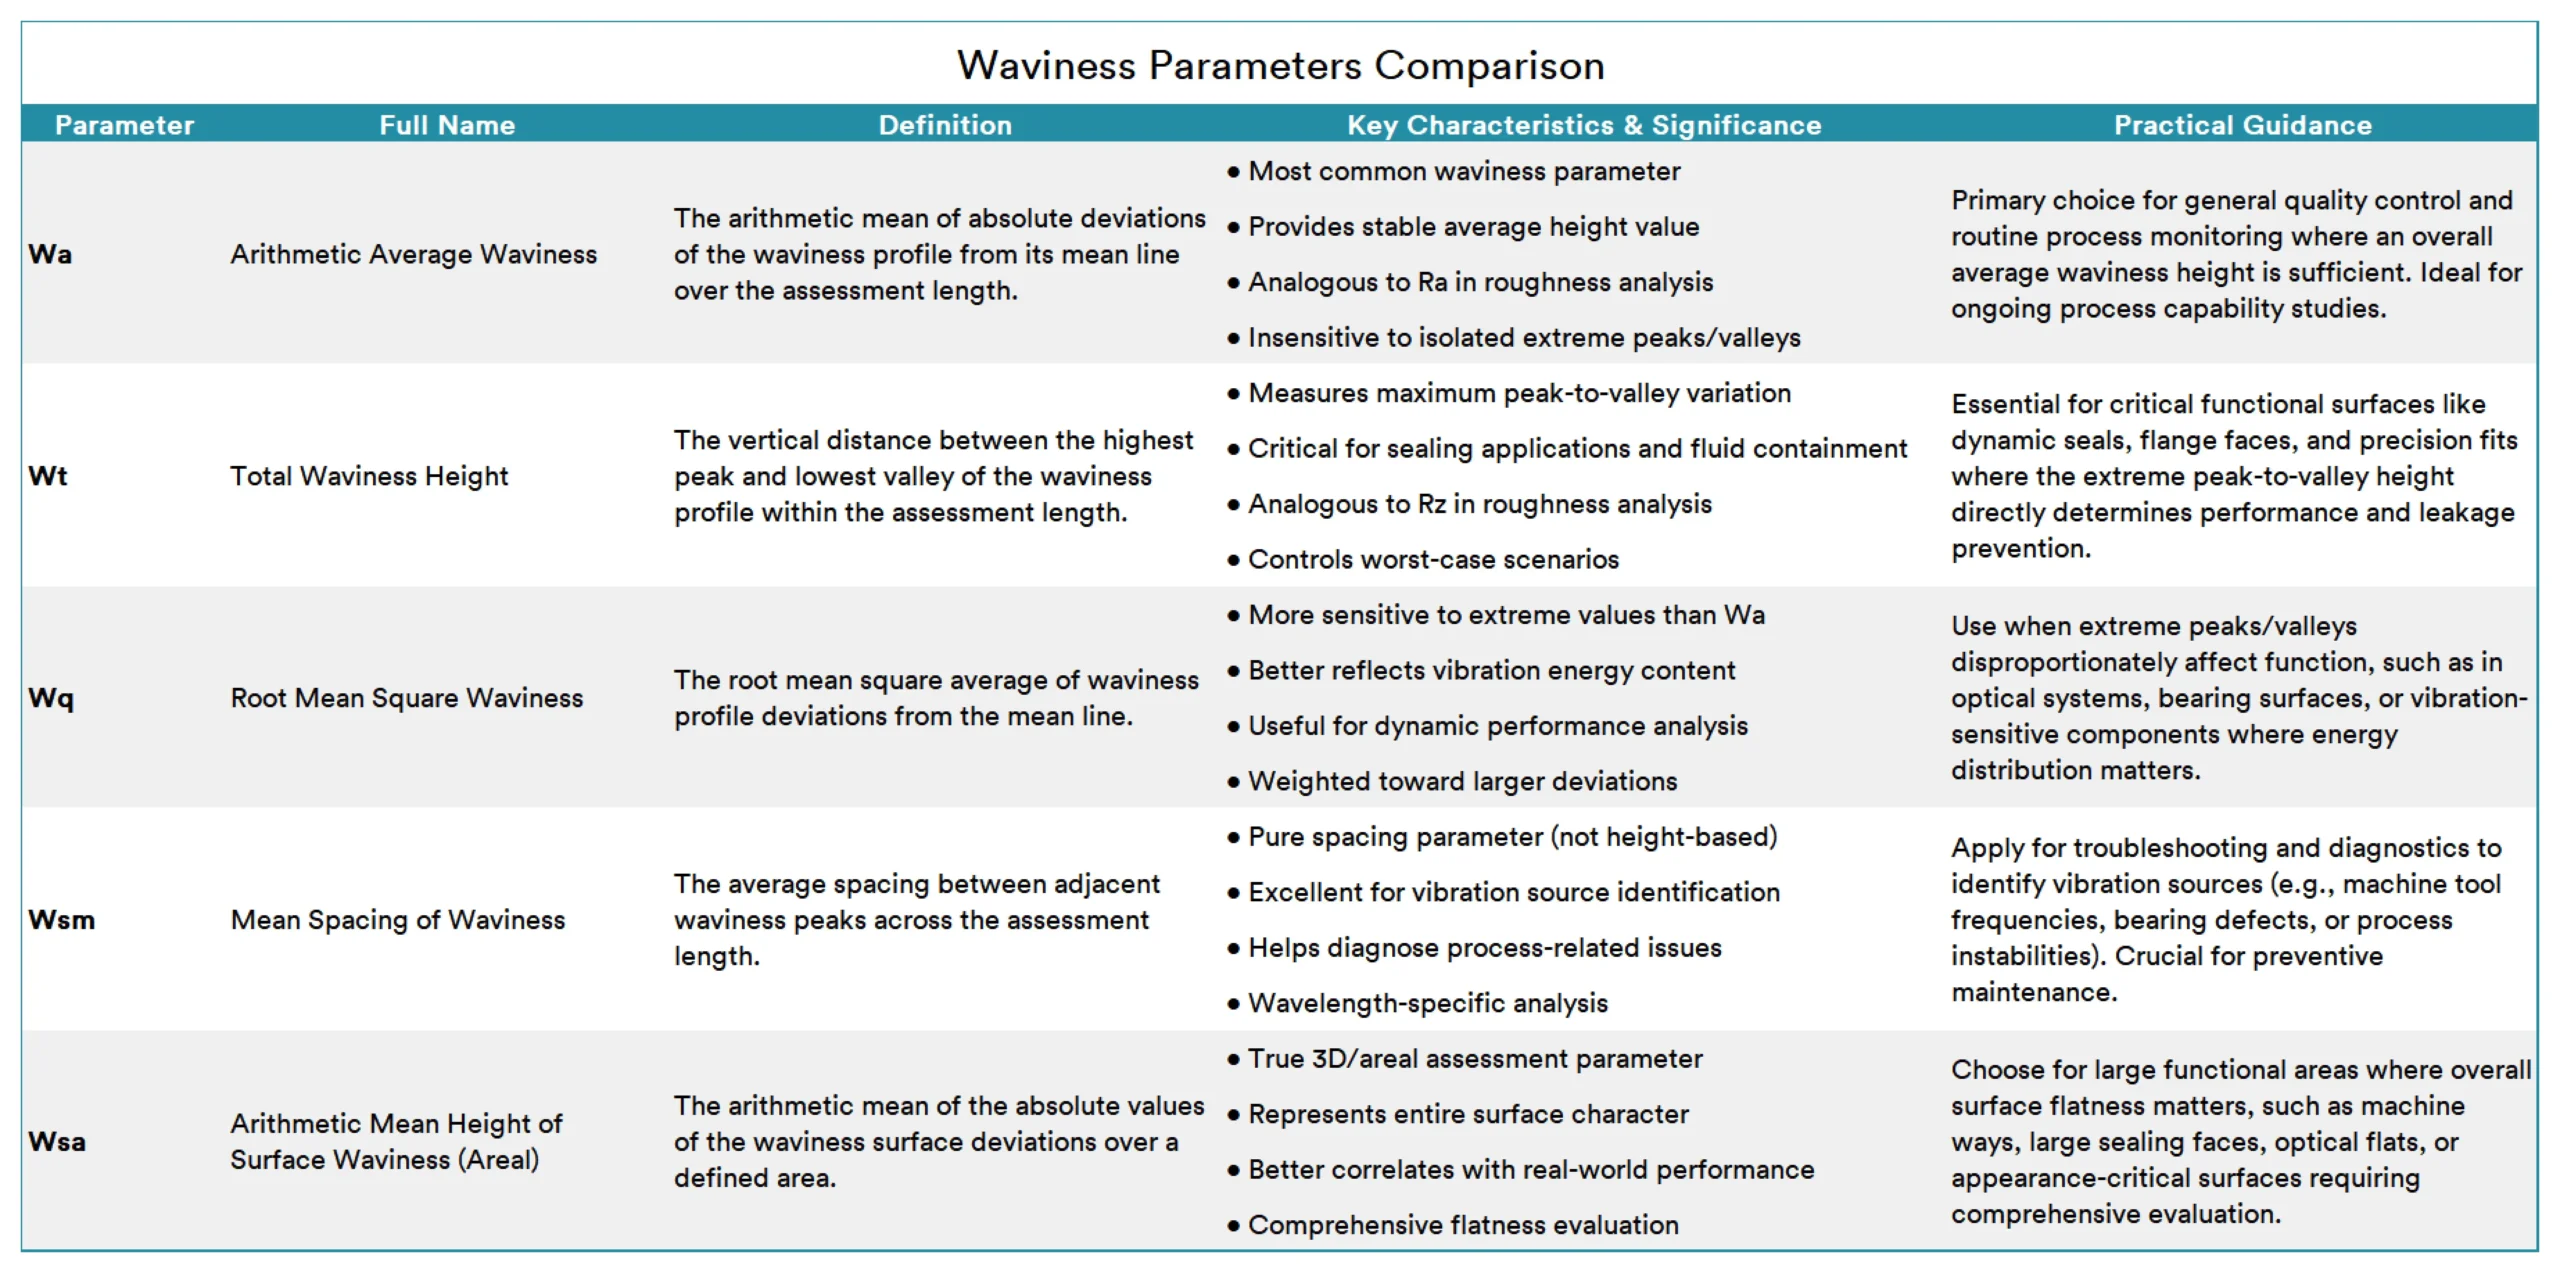
Just like with roughness, there are several key parameters used to measure and control waviness,including Wa Wt Wq Wsm wsa.
Full Name: Arithmetic Average Waviness
Definition: The arithmetic mean of the absolute deviations of the waviness profile from the centerline over the sampling length. It is analogous to Ra but measured on the waviness profile (larger scale undulations).
Calculation Formula:

where zw(x) is the waviness profile height relative to the centerline.
Significance: Provides a stable average measure of waviness amplitude. Lower Wa indicates a flatter surface waviness. Used widely in quality control to assess the overall waviness level.
Full Name: Total Waviness Height
Definition: The vertical distance between the highest peak and lowest valley of the waviness profile within the evaluation length.
Calculation Formula:
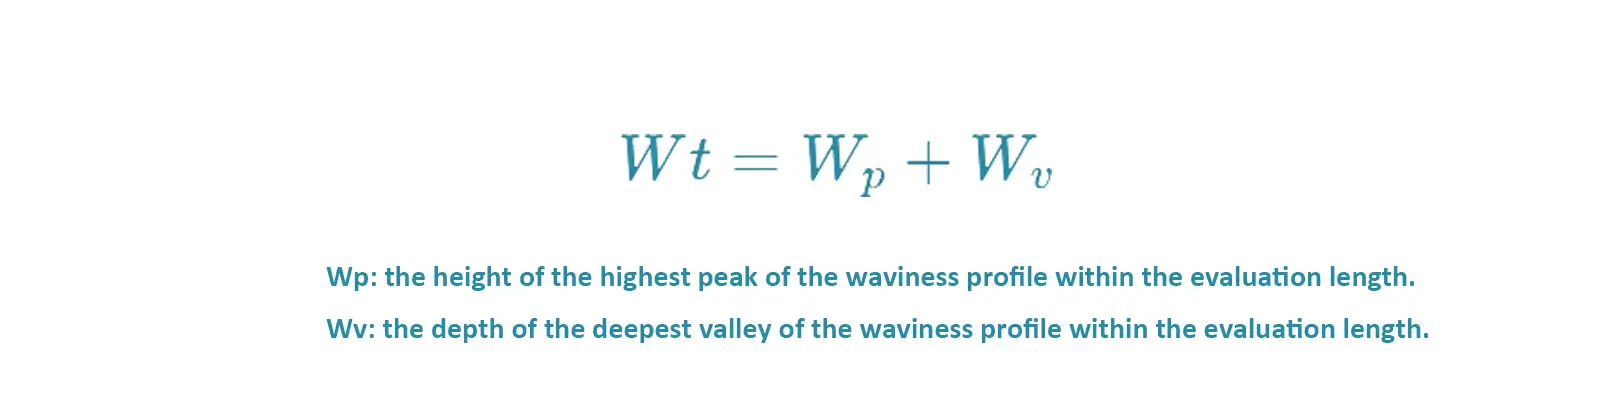
where Zwp is the height of the highest waviness peak and ZwvZwv is the depth of the lowest waviness valley.
Significance: Reflects the extreme waviness variation and is critical in applications requiring precise sealing or fit, where maximum waviness impacts functionality.
Full Name: Root Mean Square Waviness
Definition: The root mean square value of the waviness profile deviations from the mean line, giving more weight to extreme peaks or valleys.
Calculation Formula:

where zˉw is the mean waviness height.
Significance: More sensitive to extremes than Wa, making it useful for statistical analysis of waviness and assessing materials where peak effects matter, such as optics or contact mechanics.
Full Name: Mean Spacing of Waviness
Definition: The average horizontal distance between adjacent waviness peaks, representing the waviness wavelength or pattern spacing.
Calculation Formula:
where Lw,j is the distance between adjacent peaks, and mm is the number of measured peak spacings.
Full Name: Arithmetic Mean Height of Surface Waviness
Definition: Wsa is the arithmetic average of the surface waviness heights over a specified area after filtering out both roughness (high-frequency components) and form error (low-frequency components). It represents the general waviness level on a surface area.
Calculation:
Wsa is similar to Wa (which is for a profile line), but Wsa is a 3D area parameter. It is calculated as the arithmetic mean of the absolute deviations of the waviness height values zw(x,y)zw(x,y) from the mean waviness plane over the measured surface area AA:
Significance: A key parameter for diagnosing causes of waviness like vibration frequencies. Larger Wsm indicates lower frequency, widely spaced waviness, while smaller Wsm indicates dense peaks often caused by higher-frequency vibrations.
Significance:
Wsa reflects large-scale waviness across the surface area, providing a realistic measure of waviness on critical surfaces such as large sealing faces or optical components.
Important for assessing uniformity of waviness on large planes and impacting friction, sealing, and optical properties.
Commonly used in automotive, aerospace, and optical parts inspection.
Comparison Table of Waviness Parameters
Notes / Tips:
Wa is analogous to Ra but at a larger (waviness) scale.
Wt is analogous to Rz/Ry, controlling maximum peak-to-valley height.
Wq is analogous to Rq, emphasizing extreme deviations.
Wsm is a spacing parameter, not height-related, useful for identifying the source of periodic disturbances.
Surface Lay refers to the primary direction, pattern, or orientation of the surface texture resulting from the manufacturing process, such as machining, grinding, or polishing. It represents the dominant direction of the microscopic grooves or patterns left on the surface.
Lay is the directional pattern or texture on a part’s surface created by the manufacturing method. While sometimes invisible to the naked eye, it exists at a microscopic level and directly influences part performance.
On engineering drawings, lay is specified using a standardized symbol system based on the basic surface texture symbol (√) with an added line or shape that indicates the required pattern direction.
The lay of a surface is a direct result of the manufacturing process used.
Turning: A lathe tool moves around the workpiece, leaving circular or concentric texture marks on the surface.
Milling: A milling cutter moves across a surface, leaving texture marks that are parallel to the direction of the cut.
Grinding: Grinding with a wheel creates texture marks that are also parallel to the grinding direction.
Polishing: Polishing tends to make the surface texture less obvious, often creating a more random lay.
The direction of a surface’s texture can have a big impact on a part’s function.
Friction and Wear: For parts that slide against each other, the lay can significantly affect friction. If the lay is parallel to the direction of motion, friction is reduced. If it’s perpendicular, friction increases.
Lubrication: A specific lay (like a circular pattern on a shaft) can create tiny channels that help trap and distribute lubricants, which reduces friction and heat.
Aesthetics: In many consumer products, a specific lay is a deliberate part of the design, like the brushed metal finish on a phone or laptop.
Surface Measurement: To get an accurate roughness reading with a profilometer, the measurement must be taken perpendicular to the lay to ensure the probe captures all the peaks and valleys.
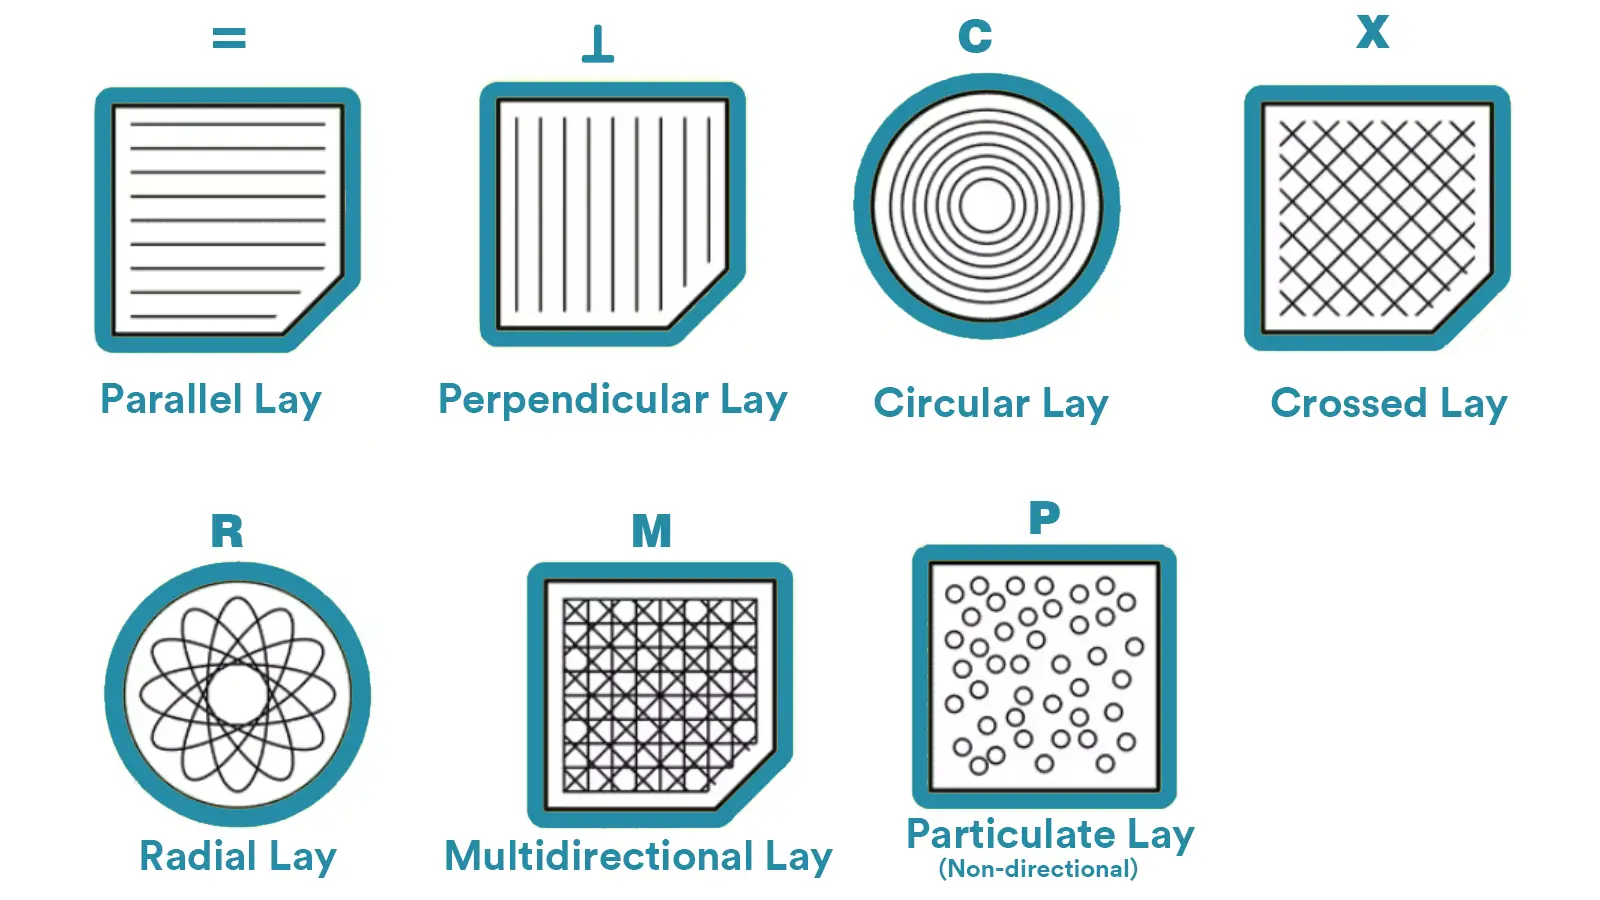
Parallel Lay: The surface lines run parallel in one direction, common in processes like turning.
Perpendicular Lay: Surface texture lines run perpendicular to a reference edge or direction.
Circular Lay: Concentric circular patterns often produced in processes like turning or facing.
Radial Lay: Lines radiate outward from a central point, seen in some grinding or machining operations.
Crossed Lay: Intersecting diagonally oriented lines forming a grid or lattice pattern.
Multi-directional or Isotropic Lay: Patterns without a dominant direction, appearing random or uniform in all directions.
Common Lay Patterns Table
On technical drawings, lay is indicated using standardized symbols next to the surface texture callout, specifying the required pattern direction for manufacturing and inspection.
Measuring surface lay involves a combination of qualitative observation and quantitative analysis. The core objectives are to determine the dominant direction, consistency, and regularity of the surface texture.
5.5.1. Visual Inspection
These methods are used for quick assessment of the general direction and type of lay.
Method: Directly observe the surface using a stereo or metallurgical microscope with angled lighting. The shadows cast by the texture under oblique illumination make the lay direction clearly visible.
Advantages: Fast, simple, and non-destructive.
Disadvantages: Subjective and does not provide quantitative data. Primarily used for initial assessment and verification of the lay symbol (e.g., parallel, perpendicular, circular).
Method: Provides extremely high-resolution images of the surface topography, revealing texture features down to the nanoscale.
Advantages: Unmatched image resolution, capable of showing the finest texture details.
Disadvantages: Expensive equipment, sample preparation can be complex. Typically used for advanced material analysis and failure analysis, not routine inspection.
5.5.1. Instrumental Analysis
These methods use specialized equipment to collect surface data and perform quantitative analysis via software.
Method: This is the most traditional and standardized quantitative method. A diamond-tipped stylus traces across the surface, recording height variations to create a profile.
Measurement Path: Multiple measurements are required. First, measure perpendicular to the presumed lay direction (this is the standard method for measuring roughness parameters like Ra, Rz). Then, measure parallel to the lay direction.
Data Comparison: Compare the profile curves from the two directions. The profile parallel to the lay is typically flatter (smaller Ra value), while the profile perpendicular to the lay shows greater variation (larger Ra value). This difference itself confirms the presence and direction of the lay.
Advantages: Compliant with ISO/ASME standards, provides direct profile curves, highly reliable.
Disadvantages: It is a single-line measurement and may not fully represent the lay characteristics of an entire area; risk of scratching soft surfaces.
Method: This is the most advanced and powerful method currently available. It uses techniques like white light interferometry or laser confocal microscopy to capture 3D topography data of an entire area, not just a single line.
How to Analyze Lay: The accompanying analysis software can automatically perform lay analysis and provide various quantitative parameters:
Lay Dominant Direction Angle: The software automatically calculates and displays the dominant direction of the texture (e.g., 45°, 90°).
Texture Aspect Ratio: Describes the strength of the directionality. A ratio close to 1 indicates isotropy (no dominant direction, like a sandblasted surface); a ratio close to 0 indicates strong directionality (like the linear lay of a turned surface).
Power Spectral Density (PSD): Transforms surface data from the spatial domain to the frequency domain, allowing precise analysis of the intensity of different wavelength components, thus quantifying the periodicity of the lay.
3D Visualization: Generates a direct 3D image of the surface, making the lay visually clear.
Advantages: Fast measurement, captures complete information of an area, provides rich quantitative parameters, non-destructive.
Disadvantages: Higher equipment cost, may require special preparation for very smooth or highly reflective surfaces.
| Measurement Method | Type | Principle | Output | Typical Application |
|---|---|---|---|---|
| Visual/Microscopic Inspection | Qualitative | Observing texture using light and shadow | Image of lay type (e.g., parallel, circular) | Quick on-site judgment, verification of drawing callouts |
| Contact Stylus Profilometer | Quantitative | Stylus traces surface, recording height | 2D profile curve; lay confirmed by comparing perpendicular/parallel measurements | Standard-compliant lab measurement, analysis accompanying roughness measurement |
| Non-Contact Optical Profiler | Quantitative | Optical scanning to acquire 3D topography | Quantitative parameters like Lay Direction Angle, Texture Aspect Ratio; 3D images | R&D, in-depth quality analysis, characterization of complex surfaces |
According to the ISO 1302 standard, lay is specified using specific symbols placed below the surface texture symbol in the callout. Check the lay Common Symbol we mentioned above.
Surface finish symbols are a set of standardized graphical symbols used on engineering drawings to specify the technical requirements for a part’s surface. They provide visual indications about the type of surface treatment, roughness values, and other related requirements, serving as a universal language between designers, engineers, and manufacturers.
Standards:
Commonly based on international standards such as ISO 1302, ASME Y14.36, and other national standards. These standards define:
Basic symbol shapes (usually a check mark “√” or “V” shape)
Additional lines or notes to specify machining types
Text to indicate roughness values (Ra, Rz, etc.)
Symbols or arrows for texture direction (Lay)
Placement:
Surface finish symbols are typically placed adjacent to the feature or surface on the drawing, often outside contour lines for clarity.
Purpose:
They serve to clearly specify manufacturing and inspection requirements, helping ensure functional and aesthetic surface qualities are met.
Practical Benefits:
Ensures unambiguous communication for manufacturing and quality control teams.
Standardizes surface finish specifications across industries and geographies.
Reduces errors, rework, and inspection disputes.
We will explain the detailed Core Symbol Types below.
Surface may be produced by any method -except when the bar or circle is specified. Check the Basic Surface Texture Symbol below, “check mark” shape.
The horizontal bar added to the basic symbol indicates material removal by machining isrequired to produce the surface and materialmust be provided for that purpose.
The circle added to the basics symbol indicates the surface must be produced by processes suchas casting, forging, hot finishing, cold finishing die casting, powder metallurgy or injectionmolding without subsequent removal of material
To be used when any surface texture values production method, treatment, cooling or other text are specified above the horizontal line or to the right of the symbol. Surface may be produced by any method except when bar or circle is specified or when the method is specified above the horizontal line.
Parallel to plane of projection symbol specifies that the lay (the direction of the surface texture) must be parallel to the plane on which the part is shown in the drawing. It is represented by a double equals sign: =. 
For example, if you see this symbol on the top view of a flat plate, it means that the machining marks—from a process like milling or grinding—should run horizontally, parallel to the longest edge of the plate as you see it. This ensures a consistent and predictable texture that can affect the part’s function, especially in applications that involve sliding or friction.
The Perpendicular to Plane of Projection Symbol (⊥) is a callout symbol used in surface texture notation to specify that the machining lay direction must be perpendicular to the projection plane of the current view in the drawing.
When the ⊥ symbol appears in a surface requirement, it indicates:
The machining lay direction must be perpendicular to the datum of the current drawing view.
The measurement direction should be parallel to the lay direction (i.e., perpendicular to the projection plane).
It is commonly used for surfaces requiring axial sealing or designed to bear radial loads.
For example, if you see this symbol on the top view of a flat plate, it means that the machining marks—from a process like milling or grinding—should run vertically, perpendicular to the longest edge of the plate as you see it. This is the opposite of the parallel lay symbol and is used when a vertical texture is needed for a specific function.
“Crossed in two oblique directions to plane of projection symbol” represents a surface texture that has machining or lay patterns created in two intersecting oblique directions relative to the projection plane — often shown with two crossing slanting lines attached to the surface finish symbol.
For example, this lay is often achieved by performing two separate machining passes—like milling or grinding—at different angles. It is used when a surface needs to have a non-directional texture, which can be beneficial for lubricant retention, or for aesthetic purposes.
The “Multi-directional symbol” in engineering drawings is used to indicate that the surface texture or lay pattern created during machining has multiple directions rather than a single or crossed directional pattern.
It is represented by the letter M. This symbol specifies that the surface texture has no single, distinguishable direction. The marks on the surface run in a random or multi-directional pattern.
For example, this lay is typically created by manufacturing processes that do not have a defined tool path, such as sandblasting, shot peening, casting, or some forms of electrolytic machining. It is used when a consistent, non-directional texture is required across the surface.
Indicates that during machining, an edged tool creates surface creases or texture in the form of concentric circles relative to the center of the surface.This type of lay is typically created by manufacturing processes like turning, facing, or boring on a lathe, where the tool moves in a circular path relative to the part.
Usually represented as curved or circular lines around a center on the surface finish symbol.
Specifies that surface texture is approximately circular, common for turned or rotationally machined parts.
Approx Radial Symbol Indicates that an edged tool produces surface creases that mostly radiate outward from the center of the surface.
This type of lay is typically created by a process that moves outward from the center, such as grinding or polishing a circular surface from its center point.
Depicted as lines radiating like spokes from the center on the surface finish symbol.
Specifies a surface texture that is mostly radial, typical in surfaces machined with tools moving outward from a center point.
We have explained all the aspects of surface finish, now let’s see Surface finish callout on the engineering drawing.
This surface finish call out below displays information such as the surface roughness value, cutoff value, sampling length, machining method, crease direction symbol, and surface waviness on the surface indication symbol.

a: Passband or sampling length and surface texture parameter symbol and value
b: Indications of the second and subsequent parameters when multiple parameters are required
c: Machining method
d: Crease and its direction
e: Machining allowance
An example of a Surface Finish Specification is shown below.
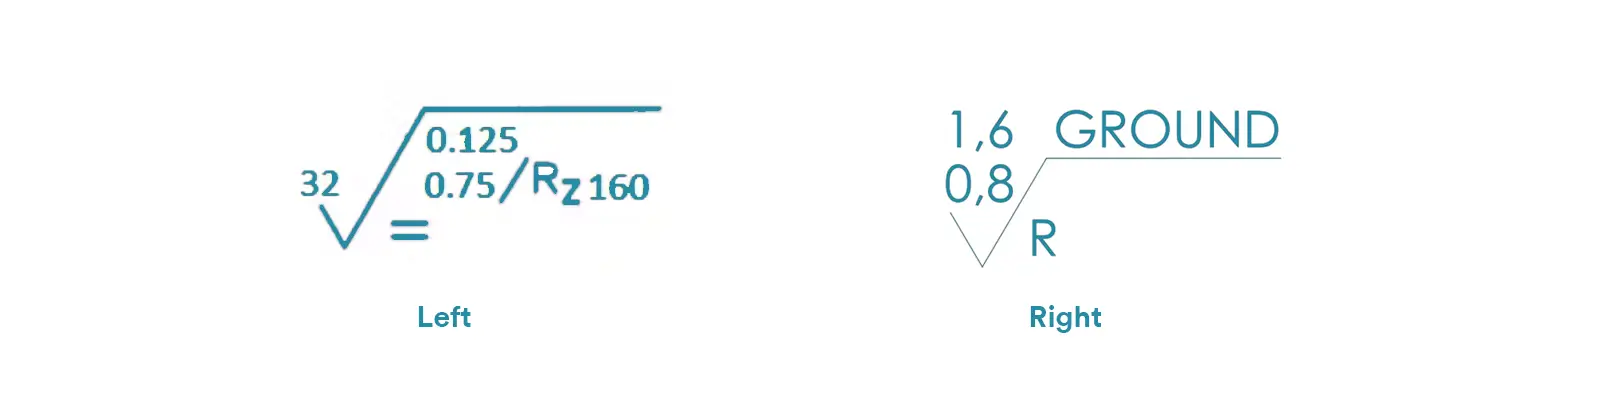
Left Example:
The surface roughness average (Ra) must not exceed 32 microinches over an evaluation length of 0.125 inches. The mean roughness depth (Rz) is specified to be no greater than 160 microinches over an evaluation length of 0.75 inches. Additionally, the lay direction is indicated to be parallel to the plane of the drawing where the symbol is shown.
Right Example:
a-Minimum Roughness = 0.8
b-Production Method/ Treatment= Grinding
f_ Maximum Roughness = 1.6
d-Roughness Spacing/ Lay Direction = Radial
In actual CNC machinnig, it callout may be simple. Check below.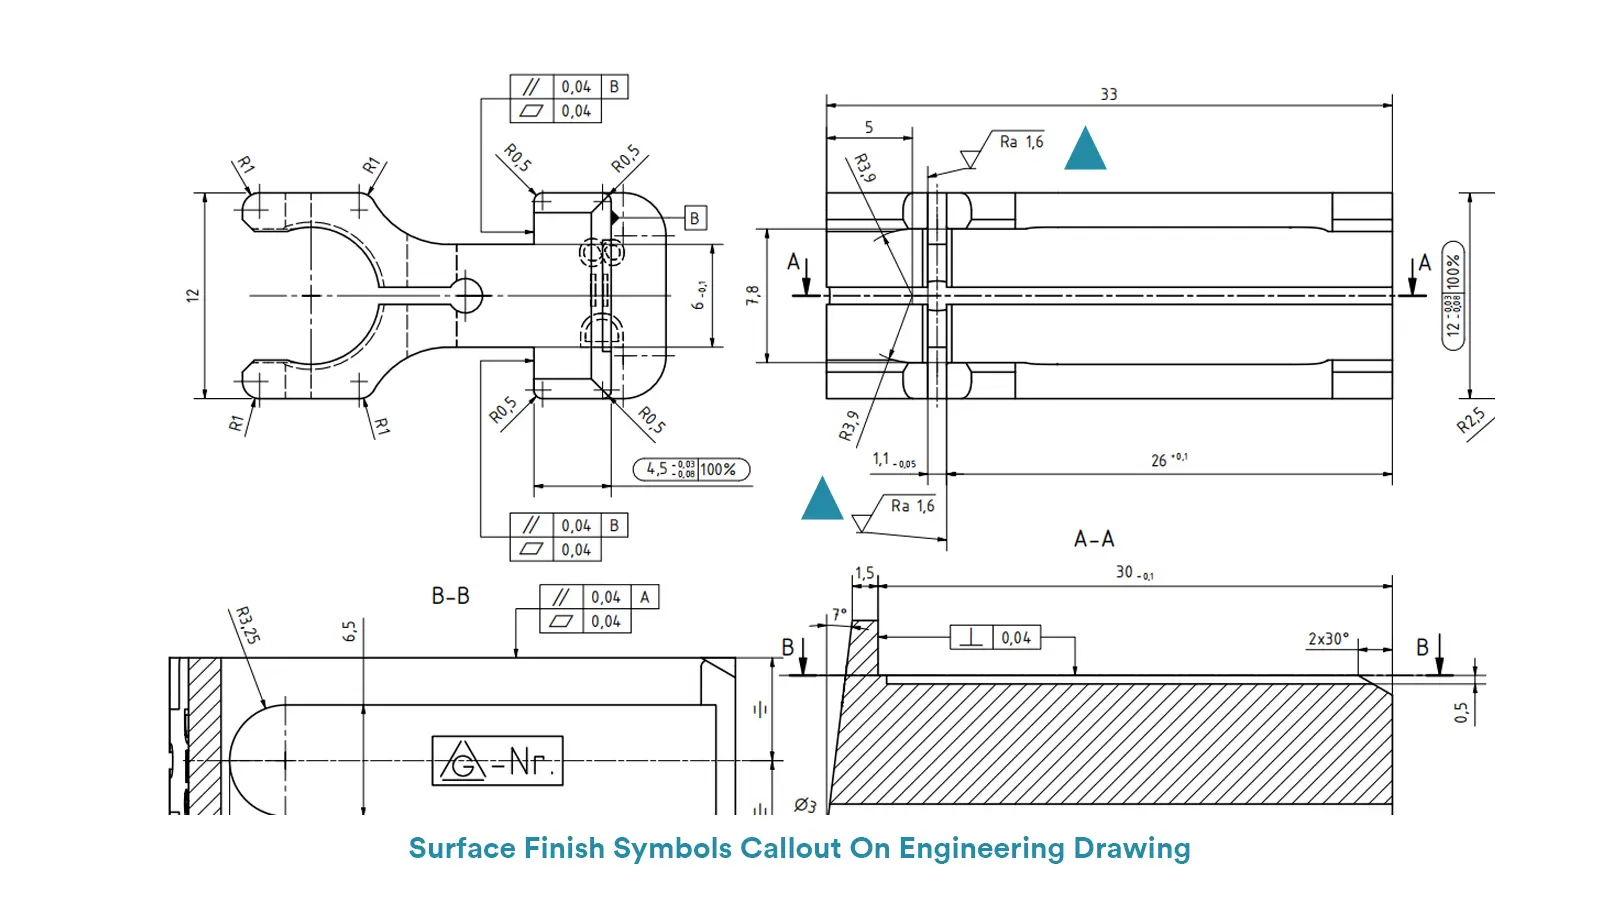
The Value of the Surface Finish Chart
The surface finish chart is more than just a table of numbers; it’s a universal communication tool that bridges the gap between design and manufacturing. Its primary value is to ensure product quality by providing a common language for engineers and machinists. It directly links a specific roughness value (like Ra) to a corresponding machining process and a common visual quality (like “smooth” or “rough”).
Using the chart correctly helps you balance a part’s performance with its manufacturing cost.
How to Read and Use the Surface Finish Chart
Here’s how to correctly use the chart in different roles:
For Design (Engineers)
When you’re designing a part, use the chart to choose a realistic and functional surface finish.
Analyze the Function: Determine what the surface’s job is. Is it for sealing, a tight fit, or just for aesthetics?
Select a Value: Based on the function, look at the chart’s descriptions to find a suitable finish. For example, choose a Ra 0.4 μm for a “Fine Finish” if precision is needed.
Don’t Over-specify: Remember that a lower number costs more. Choose the roughest finish that will still get the job done to avoid unnecessary expenses.
For Quoting (Sales and Management)
When you’re estimating the cost of a part, the chart is your guide.
Read the Value: Look at the Ra, Rz, or Ry value on the blueprint. Use the chart to understand what kind of finish that number represents.
Match to Process: The chart directly ties the finish to a general machining process (like turning, milling, or grinding).
Estimate Cost: Use this information to accurately estimate the machine time, labor, and tooling required. A part with a finer finish will be more expensive to produce.
For Manufacturing (Machinists)
When you’re making a part, the chart is your instruction manual.
Read the Blueprint: Find the roughness symbol on the drawing and identify the required Ra value and the lay direction.
Choose the Process: Use the chart’s descriptions to select the right machining process and cutting parameters to achieve that finish. For example, a rough finish might be achieved in one quick pass, while a very smooth finish might require multiple passes at a high speed.
Verify the Result: After machining, use a roughness gauge to measure the finished surface and ensure it matches the value on the chart.
Determining the right surface finish is a crucial step in part design, and it’s all about balancing a part’s function with its manufacturing cost. The general rule is to choose the roughest finish that will still allow the part to perform its job correctly.
Here’s a step-by-step guide on how to decide:
Step 1: Consider the Part’s Function
The most important factor is what the surface will be used for.
For Sliding or Bearing Surfaces: You’ll need a very smooth finish with a low Ra value to reduce friction and wear.
For Sealing Surfaces: A specific finish and lay are critical to prevent leaks. The surface must be flat, and the texture should not create a path for fluid to escape.
For Parts That Fit Together: The surface finish must be compatible with the tolerance. A part with a tight tolerance often requires a fine finish to ensure a proper fit.
For Aesthetic Surfaces: The finish is chosen for its appearance and feel. This might involve a specific lay or a certain level of smoothness to look and feel a certain way.
Step 2: Balance Performance and Cost
A finer surface finish always costs more and takes more time to achieve. Use the surface finish chart as a guide to find the right balance
Rough Machining (e.g., Casting or Sawing): This is the cheapest method and is used for non-critical surfaces.
Standard Machining (e.g., Milling or Turning): This is a good balance of cost and quality for many general-purpose parts.
Precision Machining (e.g., Grinding or Lapping): These are expensive processes used only when a part’s function absolutely requires a very smooth and precise finish.
Step 3: Make a Final Decision
To make the final call, ask yourself these questions:
What is the minimum level of smoothness required? Don’t over-specify.
Does the surface need to interact with another part? If so, consider both parts’ needs.
Does the part need a specific texture direction (Lay)? If friction or lubrication is a concern, the direction of the texture matters.
The surface finish chart acts as a universal language bridging engineers and machinists, playing a crucial role in guaranteeing product quality. It enables clear communication of surface texture requirements, ensuring the final part meets both functional and aesthetic standards.
Different types of surface finish chart pdf are listed here. Click to load.
Common pitfalls include over-specifying surface finishes, which unnecessarily increases production costs, and under-specifying, which risks part failure and compromises performance.
With the insights gained from this article, readers are encouraged to apply surface finish charts more accurately and effectively in their next design or manufacturing project, optimizing cost, quality, and reliability.
If you’re looking for CNC machining services with consistent and precise surface finishes, our team is ready to support your next project.
The profilometer moves a stylus straight across a surface, perpendicular to the lay direction.
The profilometer creates a chart called the measured surface profile, which shows the surface’s height as the stylus moves along. This initial profile contains more than just roughness; it also includes any waviness and form errors that might be present.
To isolate just the roughness, we must filter out these larger imperfections.
The measured profile is processed using a special filter that effectively “removes” the longer waves of waviness and form error. The result is a new, much flatter line called the surface roughness profile. This new profile represents only the microscopic peaks and valleys, allowing for a precise measurement of the roughness parameters.
Not necessarily. While a smaller Ra value indicates a smoother surface, it also requires more advanced, time-consuming, and expensive finishing processes. Specifying a finer finish than what’s needed for the part’s function is a common mistake that increases costs and adds no value. It’s best to choose the right Ra value for the job, not the lowest one.
Surface roughness is measured using a few different methods. The most common is Contact Measurement, which uses a stylus instrument called a profiler to physically trace the surface. For a quick estimate, you can use the Comparison Method, which involves visually and tactually comparing the part’s surface to a set of standardized roughness blocks.
If a drawing shows a surface finish symbol without a specific Ra value, it usually means that a default value applies. This default value is typically defined in the title block of the drawing, the company’s engineering standards, or it’s a value commonly associated with the specified manufacturing process (e.g., standard milling). In this situation, it’s always best practice to confirm the required value with the design engineer.
Yes, the surface roughness charts and the measurement parameters themselves are universal. The definitions of Ra, Rz, and Ry are based on the geometry of the surface, not the material. However, the specific manufacturing processes used to achieve a certain Ra value can be very different for plastics and metals. For example, a process that achieves a good finish on steel may not work the same way on plastic.
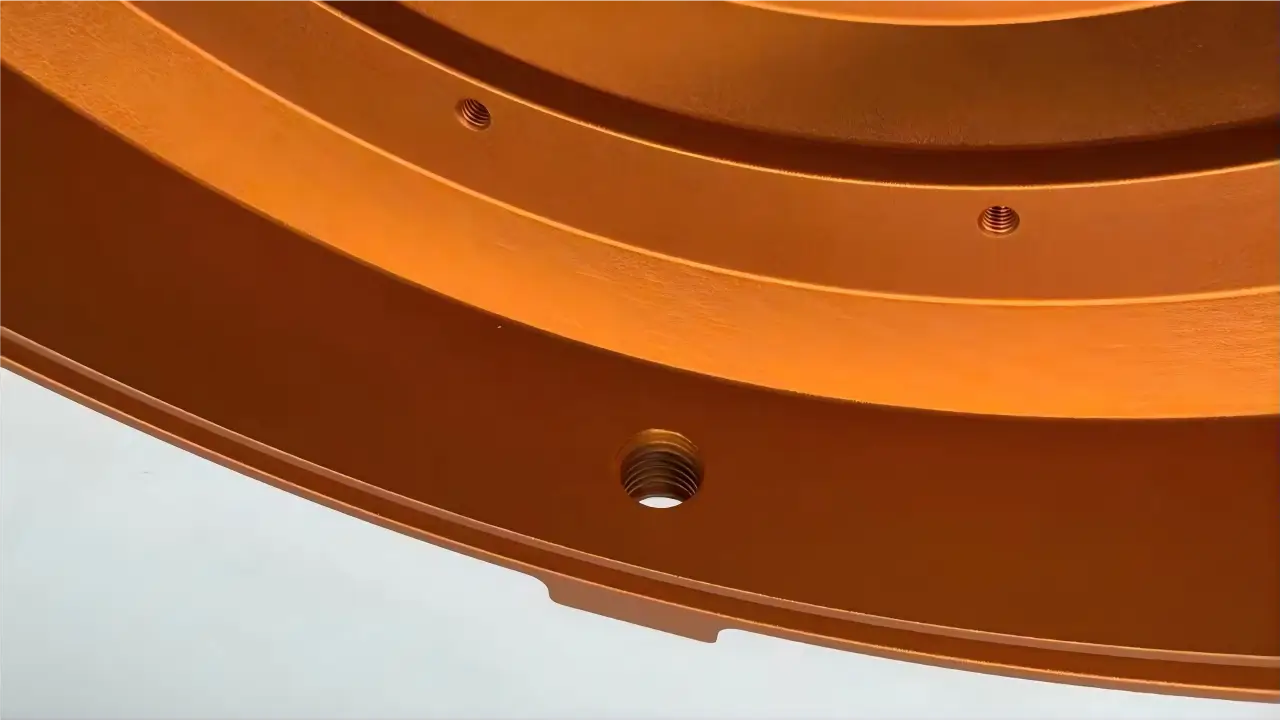
Aluminum Alloys:A typical Ra range is 0.8 to 3.2 µm, often achieved with machining processes like turning and milling. For a polished finish, values can be as low as 0.2 to 0.8 µm.
Copper and Copper Alloys: Recommended Ra values are generally between 0.4 and 3.2 µm, depending on the required precision and application.
Steel and Stainless Steel: Due to their higher hardness, a common Ra range is 0.4 to 1.6 µm. A very fine finish or polishing can achieve 0.1 to 0.4 µm.
·Cast Iron: The nature of the material results in a rougher surface, with a typical Ra range of 1.6 to 6.3 µm.
Plastics and Composites: Ra values are typically in the range of 1.6 to 3.2 µm, but this can vary depending on the specific material and manufacturing method.
Surface finish is a comprehensive term for a part’s overall surface quality, while surface roughness is a key parameter that measures the microscopic texture, but is only one component of the broader concept.
10.8. What are common surface finishes with CNC machining?
Turning / Milling:These processes typically produce an Ra value between 1.6–3.2 µm.
·Grinding: This process can achieve an Ra value between 0.2–0.8 µm, which is suitable for precision parts.
·Polishing: For ultra-smooth surfaces or specific aesthetic needs, polishing can achieve a very fine Ra value of 0.05–0.4 µm.
Simply tell us about your part’s function, appearance requirements, and budget. Based on our expertise and manufacturing capabilities, we can recommend the appropriate surface finish grade for you.
The selection of a surface roughness and the difficulty of achieving it are indeed highly dependent on the workpiece material. Achieving the same surface finish on different materials requires a distinct approach due to their unique mechanical and thermal properties.
For most industrial products, surfaces are divided into different quality grades to set clear expectations:
A-Grade Surfaces: These are high-quality, cosmetic surfaces that are expected to have no visible flaws to the naked eye.
B-Grade Surfaces: These are secondary or non-critical appearance surfaces that may allow for minor, subtle imperfections as long as they don’t affect the product’s function.
C-Grade Surfaces: These are non-visible or internal surfaces where minor scratches or blemishes are usually acceptable as long as they don’t compromise performance.
Ultimately, the final decision on whether a flaw is a quality issue should always be based on the specific quality and acceptance standards that were established and agreed upon by both the designer and the manufacturer.
Yes. Many designs only require higher finish quality on critical functional surfaces (such as sealing surfaces or mating surfaces), while non-critical areas can have lower requirements to save costs.
See the example below.
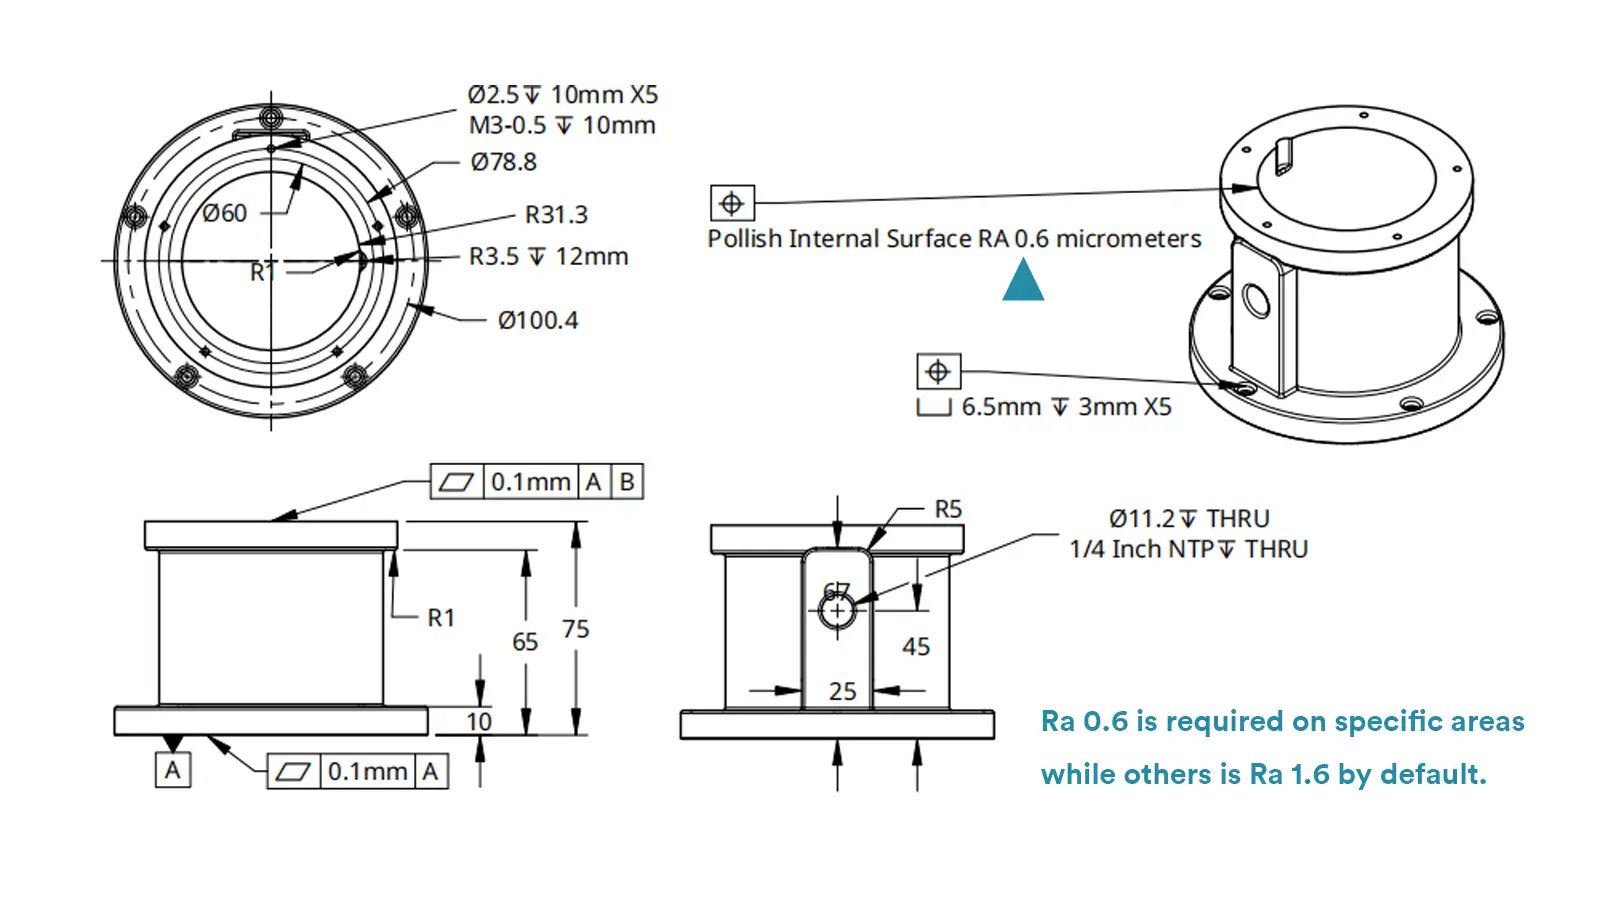
Yes. Achieving ultra-low Ra values (such as <0.2 µm) usually requires multiple processes like precision grinding, polishing, or EDM. This increases time and cost, so it is recommended only when truly necessary.
Yes. We will assign reasonable default surface finishes based on industry standards and the part’s application, and confirm with you if needed.
A 32 surface finish generally means a surface roughness of 32 microinches (µin) Ra, which is about 0.8 micrometers (µm) Ra. It indicates a relatively smooth surface, typical of standard machined parts like brake rotors.
A 125 surface finish usually means 125 microinches (µin) Ra, which is approximately 3.2 µm Ra. This is a much rougher surface compared to 32 Ra, suitable for less critical applications.
A 0.4 micron surface finish means a roughness average (Ra) of 0.4 micrometers (µm), or about 16 microinches (µin). This is a moderately smooth finish commonly seen in turned or milled parts.
N8 surface finish refers to a surface roughness grade in the ISO metric system. N8 corresponds roughly to an Ra of 0.63 µm (25 µin), which is a medium finish between rougher and smoother grades used in general machining.
The standard surface finish in CNC machining is typically around 3.2 micrometers (µm) Ra, which is equivalent to 125 microinches (µin) Ra. This “as-machined” surface finish is what parts usually come off the machine with, and it includes visible tool marks.
In short, surface finish controls the small-scale texture and micro-roughness, while flatness controls the large-scale shape deviation of a surface. Both can be specified independently and may be called out on the same surface to ensure proper function and fit.

5-Axis CNC machining is a manufacturing process that uses computer numerical control systems to operate 5-axis CNC machines capable of moving a cutting tool or a workpiece along five distinct axes simultaneously.

China is the best country for CNC machining service considering cost, precision, logistic and other factors. Statistical data suggests that China emerges as the premier destination for CNC machining.

Selecting the right prototype manufacturing supplier in China is a critical decision that can significantly impact the success of your product development project.

Machining tolerances stand for the precision of manufacturing processes and products. The lower the values of machining tolerances are, the higher the accuracy level would be.

